
Concept explainers
Videos
Continuing problem
Palisade Creek Co. is a merchandising business that uses the perpetual inventory system. The account Balances for Palisade Creek Co. as of May 1, 2016 (unless otherwise indicated), are as follows:
| 110 | Cash | $ 83,600 |
| 112 | 233,900 | |
| 115 | Merchandise Inventory | 624,400 |
| 116 | Estimated Returns Inventory | 28,000 |
| 117 | Prepaid Insurance | 16,800 |
| 118 | Store Supplies | 11,400 |
| 123 | Store Equipment | 569,500 |
| 124 | 56,700 | |
| 210 | Accounts Payable | 96,600 |
| 211 | Salaries Payable | — |
| 212 | Customers Refunds Payable | 50,000 |
| 310 | Common Stock | 100,000 |
| 311 | 585,300 | |
| 312 | Dividends | 135,000 |
| 313 | Income Summary | — |
| 410 | Sales | 5,069,000 |
| 510 | Cost of Merchandise Sold | 2,823,000 |
| 520 | Sales Salaries Expense | 664,800 |
| 521 | Advertising Expense | 281,000 |
| 522 | Depreciation Expense | — |
| 523 | Store Supplies Expense | — |
| 529 | Miscellaneous Selling Expense | 12,600 |
| 530 | Office Salaries Expense | 382,100 |
| 531 | Rent Expense | 83,700 |
| 532 | Insurance Expense | — |
| 539 | Miscellaneous Administrative Expense | 7,800 |
During May, the last month of the fiscal year, the following transactions were completed:
| May 1. | Paid rent for May, $5,000. |
| 3. | Purchased merchandise on account from Martin Co. terms 2/10t n/30, FOB shipping point, $36,000. |
| 4. | Paid freight on purchase of May 3, $600. |
| 6. | Sold merchandise on account to Korman Co., terms 2/10, n/30, FOB shipping point, $68,500. The cost of the merchandise sold was $41,000. |
| 7. | Received $22,300 cash from Halstad Co. on account. |
| 10. | Sold merchandise for cash, $54,000. The cost of the merchandise sold was $32,000. |
| 13. | Paid for merchandise purchased on May 3- |
| 15. | Paid advertising expense for last half of May, $11,000. |
| 16. | Received cash from sale of May 6. |
| 19. | Purchased merchandise for cash, $18,700. |
| 19. | Paid $33,450 to Buttons Co. on account |
| 20. | Paid Korman Co. a cash refund of $13,230 for returned merchandise from sale of May 6. The invoice amount of the returned merchandise was $13,500 and the cost of the returned merchandise was $8,000. Record the following transactions on Page 21 of the journal: |
| 20. | Sold merchandise on account to Crescent Co., terms 1/10, n/30, FOB shipping point, $110,000. The cost of the merchandise sold was $70,000. |
| 21. | For the convenience of Crescent Co., paid freight on sale of May 20. $2,300. |
| 21. | Received $42,900 cash from Gee Co. on account. |
| May 21. | Purchased merchandise on account from Osterman Co., terms 1/10, n/30, FOB destination. $88,000. |
| 24. | Returned of damaged merchandise purchased on May 21, receiving a credit memo from the seller for $5,000. |
| 26. | Refunded cash on sales made for cash. $7,500. The cost of the merchandise returned was $4,800. |
| 28. | Paid sales salaries of $56,000 and office salaries of $29,000. |
| 29. | Purchased store supplies for cash, $2,400. |
| 30. | Sold merchandise on account to Turner Co., terms 2/10, n/30, FOB shipping point, $78,750. The cost of the merchandise sold was $47,000. |
| 30. | Received cash from sale of May 20 plus freight paid on May 21. |
| 31. | Paid for purchase of May 21. less return of May 24. |
Instructions
- 1. Enter the balances of each of the accounts in the appropriate balance column of a four-column account. Write Balance in the item section, and place a check mark (✓) in the Posting Reference column. Journalize the transactions for July, starting on Page 20 of the journal.
- 2. Post the journal to the general ledger, extending the month-end balances to the appropriate balance columns after all posting is completed. In this problem, you are not required to update or post to the accounts receivable and accounts payable subsidiary ledgers.
- 3. Prepare an unadjusted
trial balance . - 4. At the end of May, the following adjustment data were assembled. Analyze and use these data to complete (5) and (6).
| a. | Merchandise inventory on May 31 | $570,000 | |
| b. | Insurance expired during the year | 12,000 | |
| c. | Store supplies on hand on May 31 | 4,000 | |
| d. | Depreciation for the current year | 14,000 | |
| e. | Accrued salaries on May 31: | ||
| Sales salaries | $7,000 | ||
| Office salaries | 6,600 | 13,600 | |
| f. | The adjustment for customer returns and allowances is $60,000 for sales and $35,000 for cost of merchandise sold. | ||
- 5. (Optional) Enter the unadjusted trial balance on a 10-column end-of-period spreadsheet (work sheet), and complete the spreadsheet.
- 6. Journalize and post the
adjusting entries . Record the adjusting entries on Page 22 of the journal. - 7. Prepare an adjusted trial balance.
- 8. Prepare an income statement, a retained earnings statement, and a
balance sheet . - 9. Prepare and
post the closing entries. Record the closing entries on Page 23 of the journal. Indicate closed accounts by inserting a line in both the Balance columns opposite the closing entry. Insert the new balance in the retained earnings account.
10. Prepare a post-closing trial balance.
Comprehensive Problem
1, 2, 6, and 9.
To Post: The balance of each of the accounts.
Explanation of Solution
Enter the balances of each of the accounts.
Cash Account:
| Cash Account | Account No. 110 | ||||||
| Date | Item |
Post. Ref. |
Debit | Credit | Balance ($) | ||
| Debit | Credit | ||||||
| 2016 | |||||||
| May | 1 |
|
✓ | 83,600 | |||
| 1 | 20 | 5,000 | |||||
| 4 | 20 | 600 | |||||
| 7 | 20 | 22,300 | |||||
| 10 | 20 | 54,000 | |||||
| 13 | 20 | 35,280 | |||||
| 15 | 20 | 11,000 | |||||
| 16 | 20 | 67,130 | |||||
| 19 | 20 | 18,700 | |||||
| 19 | 20 | 33,450 | |||||
| 20 | 20 | 13,230 | |||||
| 21 | 21 | 2,300 | |||||
| 21 | 21 | 42,900 | |||||
| 26 | 21 | 7,500 | |||||
| 28 | 21 | 85,000 | |||||
| 29 | 21 | 2,400 | |||||
| 30 | 21 | 111,200 | |||||
| 31 | 21 | 82,170 | 84,500 | ||||
Table (1)
Accounts Receivable Account:
| Accounts Receivable | Account No. 112 | ||||||
| Date | Item |
Post. Ref. |
Debit | Credit | Balance ($) | ||
| Debit | Credit | ||||||
| 2016 | |||||||
| May | 1 |
|
✓ | 233,900 | |||
| 6 | 20 | 67,130 | |||||
| 7 | 20 | 22,300 | |||||
| 16 | 20 | 67,130 | |||||
| 20 | 21 | 108,900 | |||||
| 21 | 21 | 2,300 | |||||
| 21 | 21 | 42,900 | |||||
| 30 | 21 | 77,175 | |||||
| 30 | 21 | 111,200 | 245,875 | ||||
Table (2)
Inventory Account:
| Inventory | Account No. 115 | ||||||
| Date | Item |
Post. Ref. |
Debit | Credit | Balance ($) | ||
| Debit | Credit | ||||||
| 2016 | |||||||
| May | 1 |
|
✓ | 624,400 | |||
| 3 | 20 | 35,280 | |||||
| 4 | 20 | 600 | |||||
| 6 | 20 | 41,000 | |||||
| 10 | 20 | 32,000 | |||||
| 19 | 20 | 18,700 | |||||
| 20 | 20 | 8,000 | |||||
| 20 | 21 | 70,000 | |||||
| 21 | 21 | 87,120 | |||||
| 24 | 21 | 4,950 | |||||
| 26 | 21 | 4,800 | |||||
| 30 | 21 | 47,000 | 583,950 | ||||
| 31 | Adjusting | 22 | 13,950 | 570,000 | |||
Table (3)
Estimated Returns Inventory Account:
| Estimated Returns Inventory | Account No. 116 | ||||||
| Date | Item |
Post. Ref. |
Debit | Credit | Balance ($) | ||
| Debit | Credit | ||||||
| 2016 | |||||||
| May | 1 |
|
✓ | 28,000 | |||
| 20 | 20 | 8,000 | |||||
| 26 | 21 | 4,800 | 15,200 | ||||
| 31 | Adjusting | 22 | 35,000 | 50,200 | |||
Table (4)
Prepaid Insurance Account:
| Prepaid Insurance | Account No. 117 | ||||||
| Date | Item |
Post. Ref. |
Debit | Credit | Balance ($) | ||
| Debit | Credit | ||||||
| 2016 | |||||||
| May | 1 |
|
✓ | 16,800 | |||
| 31 | Adjusting | 22 | 12,000 | 4,800 | |||
Table (5)
Store Supplies Account:
| Store Supplies | Account No. 118 | ||||||
| Date | Item |
Post. Ref. |
Debit | Credit | Balance ($) | ||
| Debit | Credit | ||||||
| 2016 | |||||||
| May | 1 |
|
✓ | 11,400 | |||
| 29 | 21 | 2,400 | 13,800 | ||||
| 31 | Adjusting | 22 | 9,800 | 4,000 | |||
Table (6)
Store Equipment Account:
| Store Equipment | Account No. 123 | ||||||
| Date | Item |
Post. Ref. |
Debit | Credit | Balance ($) | ||
| Debit | Credit | ||||||
| 2016 | |||||||
| May | 1 |
|
✓ | 569,500 | |||
Table (7)
Accumulated Depreciation – Store Equipment Account:
| Accumulated Depreciation – Store Equipment | Account No. 124 | ||||||
| Date | Item |
Post. Ref. |
Debit | Credit | Balance ($) | ||
| Debit | Credit | ||||||
| 2016 | |||||||
| May | 1 |
|
✓ | 56,700 | |||
| 31 | Adjusting | 22 | 14,000 | 70,700 | |||
Table (8)
Accounts Payable Account:
| Accounts Payable | Account No. 210 | ||||||
| Date | Item |
Post. Ref. |
Debit | Credit | Balance ($) | ||
| Debit | Credit | ||||||
| 2016 | |||||||
| May | 1 |
|
✓ | 96,600 | |||
| 3 | 20 | 35,280 | |||||
| 13 | 20 | 35,280 | |||||
| 19 | 20 | 33,450 | |||||
| 21 | 21 | 87,120 | |||||
| 24 | 21 | 4,950 | |||||
| 31 | 21 | 82,170 | 63,150 | ||||
Table (9)
Salaries Payable Account:
| Salaries Payable | Account No. 211 | ||||||
| Date | Item |
Post. Ref. |
Debit | Credit | Balance ($) | ||
| Debit | Credit | ||||||
| 2016 | |||||||
| May | 31 | Adjusting | 22 | 13,600 | 13,600 | ||
Table (10)
Customers Refunds Payable Account:
| Customers Refunds Payable | Account No. 212 | ||||||
| Date | Item |
Post. Ref. |
Debit | Credit | Balance ($) | ||
| Debit | Credit | ||||||
| 2016 | |||||||
| May | 1 |
|
✓ | 50,000 | |||
| 20 | 20 | 13,230 | |||||
| 26 | 21 | 7,500 | 29,270 | ||||
| 31 | Adjusting | 22 | 60,000 | 89,270 | |||
Table (11)
Common Stock Account:
| Common Stock | Account No. 310 | ||||||
| Date | Item |
Post. Ref. |
Debit | Credit | Balance ($) | ||
| Debit | Credit | ||||||
| 2016 | |||||||
| May | 1 |
|
✓ | 100,000 | |||
Table (12)
Retained Earnings Account:
| Retained Earnings | Account No. 311 | ||||||
| Date | Item |
Post. Ref. |
Debit | Credit | Balance ($) | ||
| Debit | Credit | ||||||
| 2017 | |||||||
| June | 1 |
|
✓ | 585,300 | |||
| 2016 | |||||||
| May | 31 | Closing | 23 | 741,855 | |||
| 31 | Closing | 23 | 135,000 | 1,192,155 | |||
Table (13)
Dividends Account:
| Dividends | Account No. 312 | ||||||
| Date | Item |
Post. Ref. |
Debit | Credit | Balance ($) | ||
| Debit | Credit | ||||||
| 2016 | |||||||
| May | 1 |
|
✓ | 135,000 | |||
| 31 | Closing | 23 | 135,000 | ||||
Table (14)
Income Summary Account:
| Income Summary | Account No. 313 | ||||||
| Date | Item |
Post. Ref. |
Debit | Credit | Balance ($) | ||
| Debit | Credit | ||||||
| 2016 | |||||||
| May | 31 | Closing | 23 | 5,316,205 | |||
| 31 | Closing | 23 | 4,574,350 | 741,855 | |||
| 31 | Closing | 23 | 741,855 | ||||
Table (15)
Sales Account:
| Sales | Account No. 410 | ||||||
| Date | Item |
Post. Ref. |
Debit | Credit | Balance ($) | ||
| Debit | Credit | ||||||
| 2016 | |||||||
| May | 1 |
|
✓ | 5,069,000 | |||
| 6 | 20 | 67,130 | |||||
| 10 | 20 | 54,000 | |||||
| 20 | 21 | 108,900 | |||||
| 30 | 21 | 77,175 | 5,376,205 | ||||
| 31 | Adjusting | 22 | 60,000 | 5,316,205 | |||
| 31 | Closing | 23 | 5,316,205 | ||||
Table (16)
Cost of Goods Sold Account:
| Cost of Goods Sold | Account No. 510 | ||||||
| Date | Item |
Post. Ref. |
Debit | Credit | Balance ($) | ||
| Debit | Credit | ||||||
| 2016 | |||||||
| May | 1 |
|
✓ | 2,823,000 | |||
| 6 | 20 | 41,000 | |||||
| 10 | 20 | 32,000 | |||||
| 20 | 21 | 70,000 | |||||
| 30 | 21 | 47,000 | 3,013,000 | ||||
| 31 | Adjusting | 22 | 13,950 | ||||
| 31 | Adjusting | 22 | 35,000 | 2,991,950 | |||
| 31 | Closing | 23 | 2,991,950 | ||||
Table (17)
Sales Salaries Expense Account:
| Sales Salaries Expense | Account No. 520 | ||||||
| Date | Item |
Post. Ref. |
Debit | Credit | Balance ($) | ||
| Debit | Credit | ||||||
| 2016 | |||||||
| May | 1 |
|
✓ | 664,800 | |||
| 28 | 21 | 56,000 | 720,800 | ||||
| 31 | Adjusting | 22 | 7,000 | 727,800 | |||
| 31 | Closing | 23 | 727,800 | ||||
Table (18)
Advertising Expense Account:
| Advertising Expense | Account No. 521 | ||||||
| Date | Item |
Post. Ref. |
Debit | Credit | Balance ($) | ||
| Debit | Credit | ||||||
| 2016 | |||||||
| May | 1 |
|
✓ | 281,000 | |||
| 15 | 20 | 11,000 | 292,000 | ||||
| 31 | Closing | 23 | 292,000 | ||||
Table (19)
Depreciation Expense Account:
| Depreciation Expense | Account No. 522 | ||||||
| Date | Item |
Post. Ref. |
Debit | Credit | Balance ($) | ||
| Debit | Credit | ||||||
| 2016 | |||||||
| May | 31 | Adjusting | 22 | 14,000 | 14,000 | ||
| 31 | Closing | 23 | 14,000 | ||||
Table (20)
Stores Supplies Expense Account:
| Stores Supplies Expense | Account No. 523 | ||||||
| Date | Item |
Post. Ref. |
Debit | Credit | Balance ($) | ||
| Debit | Credit | ||||||
| 2016 | |||||||
| May | 31 | Adjusting | 22 | 9,800 | 9,800 | ||
| 31 | Closing | 23 | 9,800 | ||||
Table (21)
Miscellaneous Selling Expense Account:
| Miscellaneous Selling Expense | Account No. 529 | ||||||
| Date | Item |
Post. Ref. |
Debit | Credit | Balance ($) | ||
| Debit | Credit | ||||||
| 2016 | |||||||
| May | 1 |
|
✓ | 12,600 | |||
| 31 | Closing | 23 | 12,600 | ||||
Table (22)
Office Salaries Expense Account:
| Office Salaries Expense | Account No. 530 | ||||||
| Date | Item |
Post. Ref. |
Debit | Credit | Balance ($) | ||
| Debit | Credit | ||||||
| 2016 | |||||||
| May | 1 |
|
✓ | 382,100 | |||
| 28 | 21 | 29,000 | 411,100 | ||||
| 31 | Adjusting | 22 | 6,600 | 417,700 | |||
| 31 | Closing | 23 | 417,700 | ||||
Table (23)
Rent Expense Account:
| Rent Expense | Account No. 531 | ||||||
| Date | Item |
Post. Ref. |
Debit | Credit | Balance ($) | ||
| Debit | Credit | ||||||
| 2016 | |||||||
| May | 1 |
|
✓ | 83,700 | |||
| 1 | 20 | 5,000 | 88,700 | ||||
| 31 | Closing | 23 | 88,700 | ||||
Table (24)
Insurance Expense Account:
| Insurance Expense | Account No. 532 | ||||||
| Date | Item |
Post. Ref. |
Debit | Credit | Balance ($) | ||
| Debit | Credit | ||||||
| 2016 | |||||||
| May | 31 | Adjusting | 22 | 12,000 | 12,000 | ||
| 31 | Closing | 23 | 12,000 | ||||
Table (25)
Miscellaneous Administrative Expense Account:
| Miscellaneous Administrative Expense | Account No. 539 | ||||||
| Date | Item |
Post. Ref. |
Debit | Credit | Balance ($) | ||
| Debit | Credit | ||||||
| 2016 | |||||||
| May | 1 |
|
✓ | 7,800 | |||
| 31 | Closing | 23 | 7,800 | ||||
Table (26)
1. And 2.
To Record: The journal entries.
Explanation of Solution
| Date | Particulars | Post. Ref. | Page 20 | ||
| Debit ($) | Credit ($) | ||||
| 2016 | |||||
| May | 1 | Rent Expense | 531 | 5,000 | |
| Cash | 110 | 5,000 | |||
| 3 | Inventory | 115 | 35,280 | ||
| Accounts Payable | 210 | 35,280 | |||
| 4 | Inventory | 115 | 600 | ||
| Cash | 110 | 600 | |||
| 6 | Accounts Receivable | 112 | 67,130 | ||
| Sales | 410 | 67,130 | |||
| 6 | Cost of Goods Sold | 510 | 41,000 | ||
| Inventory | 115 | 41,000 | |||
| 7 | Cash | 110 | 22,300 | ||
| Accounts Receivable | 112 | 22,300 | |||
| 10 | Cash | 110 | 54,000 | ||
| Sales | 410 | 54,000 | |||
| 10 | Cost of Goods Sold | 510 | 32,000 | ||
| Inventory | 115 | 32,000 | |||
| 13 | Accounts Payable | 210 | 35,280 | ||
| Cash | 110 | 35,280 | |||
| 15 | Advertising Expense | 521 | 11,000 | ||
| Cash | 110 | 11,000 | |||
| 16 | Cash | 110 | 67,130 | ||
| Accounts Receivable | 112 | 67,130 | |||
| 19 | Inventory | 115 | 18,700 | ||
| Cash | 110 | 18,700 | |||
| 19 | Accounts Payable | 210 | 33,450 | ||
| Cash | 110 | 33,450 | |||
| 20 | Customers Refunds Payable | 212 | 13,230 | ||
| Cash | 110 | 13,230 | |||
| 20 | Inventory | 115 | 8,000 | ||
| Estimated Returns Inventory | 116 | 8,000 | |||
| Date | Particulars | Post. Ref. | Page 21 | ||
| Debit ($) | Credit ($) | ||||
| 20 | Accounts Receivable | 112 | 108,900 | ||
| Sales | 410 | 108,900 | |||
| 20 | Cost of Goods Sold | 510 | 70,000 | ||
| Inventory | 115 | 70,000 | |||
| 21 | Accounts Receivable | 112 | 2,300 | ||
| Cash | 110 | 2,300 | |||
| 21 | Cash | 110 | 42,900 | ||
| Accounts Receivable | 112 | 42,900 | |||
| 21 | Inventory | 115 | 87,120 | ||
| Accounts Payable | 210 | 87,120 | |||
| 24 | Accounts Payable | 210 | 4,950 | ||
| Inventory | 115 | 4,950 | |||
| 26 | Customers Refunds Payable | 212 | 7,500 | ||
| Cash | 110 | 7,500 | |||
| 26 | Inventory | 115 | 4,800 | ||
| Estimated Returns Inventory | 116 | 4,800 | |||
| 28 | Sales Salaries Expense | 520 | 56,000 | ||
| Office Salaries Expense | 530 | 29,000 | |||
| Cash | 110 | 85,000 | |||
| 29 | Store Supplies | 118 | 2,400 | ||
| Cash | 110 | 2,400 | |||
| 30 | Accounts Receivable | 112 | 77,175 | ||
| Sales | 410 | 77,175 | |||
| 30 | Cost of Goods Sold | 510 | 47,000 | ||
| Inventory | 115 | 47,000 | |||
| 30 | Cash | 110 | 111,200 | ||
| Accounts Receivable | 112 | 111,200 | |||
| 31 | Accounts Payable | 210 | 82,170 | ||
| Cash | 110 | 82,170 | |||
Table (27)
3.
To Prepare: The unadjusted trial balance of Company P.
Explanation of Solution
Prepare an unadjusted trial balance.
P Company Unadjusted Trial Balance As on May 31, 2016 |
|||
| Accounts | Account No. |
Debit Balances ($) |
Credit Balances ($) |
| Cash | 110 | 84,500 | |
| Accounts Receivable | 112 | 245,875 | |
| Inventory | 115 | 583,950 | |
| Estimated Returns Inventory | 116 | 15,200 | |
| Prepaid Insurance | 117 | 16,800 | |
| Store Supplies | 118 | 13,800 | |
| Store Equipment | 123 | 569,500 | |
| Accumulated Depreciation—Store Equipment | 124 | 56,700 | |
| Accounts Payable | 210 | 63,150 | |
| Salaries Payable | 211 | — | |
| Customers Refunds Payable | 212 | 29,270 | |
| Common Stock | 310 | 100,000 | |
| Retained Earnings | 311 | 585,300 | |
| Dividends | 312 | 135,000 | |
| Sales | 410 | 5,376,205 | |
| Cost of Goods Sold | 510 | 3,013,000 | |
| Sales Salaries Expense | 520 | 720,800 | |
| Advertising Expense | 521 | 292,000 | |
| Depreciation Expense | 522 | — | |
| Store Supplies Expense | 523 | — | |
| Miscellaneous Selling Expense | 529 | 12,600 | |
| Office Salaries Expense | 530 | 411,100 | |
| Rent Expense | 531 | 88,700 | |
| Insurance Expense | 532 | — | |
| Miscellaneous Administrative Expense | 539 | 7,800 | |
| Total | 6,210,625 | 6,210,625 | |
Table (28)
4. and 6.
To Record: The adjusting entry.
Explanation of Solution
| Date | Particulars |
Post. Ref. |
Page 22 | ||
| Debit ($) | Credit ($) | ||||
| 2016 | Adjusting Entries | ||||
| May | 31 | Cost of Goods Sold | 510 | 13,950 | |
| Inventory | 115 | 13,950 | |||
| 31 | Insurance Expense | 532 | 12,000 | ||
| Prepaid Insurance | 117 | 12,000 | |||
| 31 | Store Supplies Expense | 523 | 9,800 | ||
| Store Supplies | 118 | 9,800 | |||
| 31 | Depreciation Expense | 522 | 14,000 | ||
Accumulated. Depreciation —Store Equipment |
124 | 14,000 | |||
| 31 | Sales Salaries Expense | 520 | 7,000 | ||
| Office Salaries Expense | 530 | 6,600 | |||
| Salaries Payable | 211 | 13,600 | |||
| 31 | Sales | 410 | 60,000 | ||
| Customer Refunds Payable | 212 | 60,000 | |||
| 31 | Estimated Returns Inventory | 116 | 35,000 | ||
| Cost of Goods Sold | 510 | 35,000 | |||
Table (29)
7.
To Prepare: The adjusted trial balance of Company P.
Explanation of Solution
Prepare the adjusted trial balance.
P Company Adjusted Trial Balance As on May 31, 2016 |
|||
| Particulars | Account No. |
Debit Balances ($) |
Credit Balances ($) |
| Cash | 110 | 84,500 | |
| Accounts Receivable | 112 | 245,875 | |
| Inventory | 115 | 570,000 | |
| Estimated Returns Inventory | 116 | 50,200 | |
| Prepaid Insurance | 117 | 4,800 | |
| Store Supplies | 118 | 4,000 | |
| Store Equipment | 123 | 569,500 | |
| Accumulated Depreciation—Store Equipment | 124 | 70,700 | |
| Accounts Payable | 210 | 63,150 | |
| Salaries Payable | 211 | 13,600 | |
| Customers Refunds Payable | 212 | 89,270 | |
| Common Stock | 310 | 100,000 | |
| Retained Earnings | 311 | 585,300 | |
| Dividends | 312 | 135,000 | |
| Sales | 410 | 5,316,205 | |
| Cost of Goods Sold | 510 | 2,991,950 | |
| Sales Salaries Expense | 520 | 727,800 | |
| Advertising Expense | 521 | 292,000 | |
| Depreciation Expense | 522 | 14,000 | |
| Store Supplies Expense | 523 | 9,800 | |
| Miscellaneous Selling Expense | 529 | 12,600 | |
| Office Salaries Expense | 530 | 417,700 | |
| Rent Expense | 531 | 88,700 | |
| Insurance Expense | 532 | 12,000 | |
| Miscellaneous Administrative Expense | 539 | 7,800 | |
| Total | 6,238,225 | 6,238,225 | |
Table (30)
8.
To Prepare: The income statement, retained earnings, and balance sheet of P Company.
Explanation of Solution
Prepare the income statement.
P Company Income Statement For the Year Ended May 31, 2016 |
|||
| Particulars | Amount ($) | Amount ($) | Amount ($) |
| Sales | 5,316,205 | ||
| Cost of goods sold | (2,991,950) | ||
| Gross profit | 2,324,255 | ||
| Expenses: | |||
| Selling expenses: | |||
| Sales salaries expense | 727,800 | ||
| Advertising expense | 292,000 | ||
| Depreciation expense | 14,000 | ||
| Store supplies expense | 9,800 | ||
| Miscellaneous selling expense | 12,600 | ||
| Total selling expenses | 1,056,200 | ||
| Administrative expenses: | |||
| Office salaries expense | 417,700 | ||
| Rent expense | 88,700 | ||
| Insurance expense | 12,000 | ||
| Miscellaneous administrative expense | 7,800 | ||
| Total administrative expenses | 526,200 | ||
| Total expenses | (1,582,400) | ||
| Net income | 741,855 | ||
Table (31)
Prepare the retained earnings statement.
P Company Retained Earnings Statement For the Year Ended May 31, 2016 |
||
| Retained earnings, June 1, 2015 | 585,300 | |
| Net income | 741,855 | |
| Dividends | (135,000) | |
| Change in retained earnings | 606,855 | |
| Retained earnings, May 31, 2016 | 1,192,155 | |
Table (32)
Prepare the balance sheet of P Company.
P Company Balance Sheet As on May 31, 2016 |
||
| Assets | Amount ($) | Amount ($) |
| Current assets: | ||
| Cash | $84,500 | |
| Accounts receivable | 245,875 | |
| Inventory | 570,000 | |
| Estimated returns inventory | 50,200 | |
| Prepaid insurance | 4,800 | |
| Store supplies | 4,000 | |
| Total current assets | $ 959,375 | |
| Property, plant, and equipment: | ||
| Store equipment | $ 569,500 | |
| Accumulated depreciation—store equipment | (70,700) | |
| Total property, plant, and equipment | 498,800 | |
| Total assets | $1,458,175 | |
| Liabilities | ||
| Current liabilities: | ||
| Accounts payable | $63,150 | |
| Salaries payable | 13,600 | |
| Customers refunds payable | 89,270 | |
| Total liabilities | $ 166,020 | |
| Stockholders’ Equity | ||
| Common stock | $ 100,000 | |
| Retained earnings | 1,192,155 | |
| Total stockholders’ equity | 1,292,155 | |
| Total liabilities and stockholders’ equity | $1,458,175 | |
Table (33)
9.
To Post: The closing entries.
Explanation of Solution
Prepare the closing entries.
| Date | Particulars |
Post. Ref. |
Page 23 | ||
| Debit ($) | Credit ($) | ||||
| 2016 | Closing Entries | ||||
| May | 31 | Sales | 410 | 5,316,205 | |
| Income Summary | 313 | 5,316,205 | |||
| 31 | Income Summary | 313 | 4,574,350 | ||
| Cost of Goods Sold | 510 | 2,991,950 | |||
| Sales Salaries Expense | 520 | 727,800 | |||
| Advertising Expense | 521 | 292,000 | |||
| Depreciation Expense | 522 | 14,000 | |||
| Store Supplies Expense | 523 | 9,800 | |||
| Miscellaneous Selling Expense | 529 | 12,600 | |||
| Office Salaries Expense | 530 | 417,700 | |||
| Rent Expense | 531 | 88,700 | |||
| Insurance Expense | 532 | 12,000 | |||
| Miscellaneous Administrative Expenses | 539 | 7,800 | |||
| 31 | Income Summary | 313 | 741,855 | ||
| Retained Earnings | 311 | 741,855 | |||
| 31 | Retained Earnings | 311 | 135,000 | ||
| Dividends | 312 | 135,000 | |||
Table (34)
10.
To Prepare: The post-closing trial balance.
Explanation of Solution
Prepare the post-closing trial balance.
P Company Post-Closing Trial Balance May 31, 2016 |
|||
| Accounts | Account No. |
Debit Balances ($) |
Credit Balances ($) |
| Cash | 110 | 84,500 | |
| Accounts Receivable | 112 | 245,875 | |
| Inventory | 115 | 570,000 | |
| Estimated Returns Inventory | 116 | 50,200 | |
| Prepaid Insurance | 117 | 4,800 | |
| Store Supplies | 118 | 4,000 | |
| Store Equipment | 123 | 569,500 | |
| Accumulated Depreciation—Store Equipment | 124 | 70,700 | |
| Accounts Payable | 210 | 63,150 | |
| Salaries Payable | 211 | 13,600 | |
| Customers Refunds Payable | 212 | 89,270 | |
| Common Stock | 310 | 100,000 | |
| Retained Earnings | 311 | 1,192,155 | |
| Total | 1,528,875 | 1,528,875 | |
Table (35)
5.
To Prepare: The worksheet for Company P.
Explanation of Solution
Prepare the worksheet.
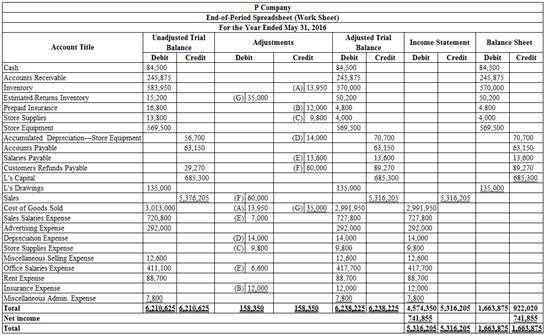
Figure (1)
Want to see more full solutions like this?
Chapter 5 Solutions
FINANCIAL AND MANAGERIAL ACCOUNTING


- Hilary owns a fruit smoothie shop at the local mall. Each smoothie requires 1/2 pound of mixed berries, which are expected to cost $5.50 per pound during the summer months. Shop employees are paid $7.00 per hour. Variable overhead consists of utilities and supplies, with a variable overhead rate of $0.12 per minute of direct labor time. Each smoothie should require 4 minutes of direct labor time. Determine the following standard costs per smoothie: Direct materials cost Direct labor cost Variable overhead costarrow_forwardgeneral accountingarrow_forwardThe following financial information is provided for Brightstar Corp.: Net Income (2023): $500 million Total Assets on January 1, 2023: $3,500 million Total Assets on December 31, 2023: $4,500 million What is Brightstar Corp. _ s return on assets (ROA) for 2023? A. 11.80% B. 12.50% C. 13.20% D. 14.00%arrow_forward
- PLEASE FILL ALL CELLS. ALL RED CELLS ARE INCORRECT OR EMPTY.arrow_forwardAssume Bright Cleaning Service had a net income of $300 for the year. The company's beginning total assets were $4,500, and ending total assets were $4,100. Calculate Bright Cleaning Service's Return on Assets (ROA). A. 6.50% B. 7.25% C. 6.98% D. 5.80%arrow_forwardwhat is the investment turnover?arrow_forward
- A California-based company had a raw materials inventory of $135,000 on December 31, 2022, and $115,000 on December 31, 2023. During 2023, the company purchased $160,000 worth of raw materials, incurred direct labor costs of $230,000, and manufacturing overhead costs of $340,000. What is the total manufacturing cost incurred by the company? A. $720,000 B. $750,000 C. $705,000 D. $735,000arrow_forwardPLEASE HELP WITH THIS PROBLEM. ALL RED CELLS ARE EMPTY OR INCORRECT.arrow_forwardSuppose during 2023, BlueStar Shipping reported the following financial information (in millions): Net Sales: $40,000 Net Income: $150 Total Assets at Beginning of Year: $26,000 • Total Assets at End of Year: $24,800 Calculate the following: (a) Asset Turnover (b) Return on Assets (ROA) as a percentagearrow_forward
- provide correct answer accounting questionarrow_forwardKubin Company’s relevant range of production is 11,000 to 14,000 units. When it produces and sells 12,500 units, its average costs per unit are as follows: Average Cost per Unit Direct materials $ 7.20 Direct labor $ 4.20 Variable manufacturing overhead $ 1.70 Fixed manufacturing overhead $ 5.20 Fixed selling expense $ 3.70 Fixed administrative expense $ 2.70 Sales commissions $ 1.20 Variable administrative expense $ 0.70 Required: For financial accounting purposes, what is the total product cost incurred to make 12,500 units? For financial accounting purposes, what is the total period cost incurred to sell 12,500 units? For financial accounting purposes, what is the total product cost incurred to make 14,000 units? For financial accounting purposes, what is the total period cost incurred to sell 11,000 units?arrow_forwardChoose a manufacturing company then discuss the following: First, name your company and list its main products and direct materials used. What is spoilage? Give an example of spoilage that might occur during the manufacturing of the company's product. What is scrap? Give an example of scrap that might occur during the manufacturing of the company's product. What does rework mean? Give an example of rework that might occur during the manufacturing of the company's product. A leading manufacturer recently said, "What has been regarded as normal spoilage in the past will not acceptable as normal spoilage in the future? What are they talking about? What do you think are the external or internal factors that may affect the level of normal spoilage in the future?arrow_forward
 Financial & Managerial AccountingAccountingISBN:9781285866307Author:Carl Warren, James M. Reeve, Jonathan DuchacPublisher:Cengage Learning
 Corporate Financial AccountingAccountingISBN:9781305653535Author:Carl Warren, James M. Reeve, Jonathan DuchacPublisher:Cengage Learning
 Accounting (Text Only)AccountingISBN:9781285743615Author:Carl Warren, James M. Reeve, Jonathan DuchacPublisher:Cengage Learning
 Cornerstones of Financial AccountingAccountingISBN:9781337690881Author:Jay Rich, Jeff JonesPublisher:Cengage Learning
 Financial AccountingAccountingISBN:9781305088436Author:Carl Warren, Jim Reeve, Jonathan DuchacPublisher:Cengage Learning
 Financial Accounting: The Impact on Decision Make...AccountingISBN:9781305654174Author:Gary A. Porter, Curtis L. NortonPublisher:Cengage Learning