Intermediate Accounting: Reporting and Analysis (Looseleaf)
2nd Edition
ISBN: 9781285453859
Author: WAHLEN
Publisher: Cengage
bartleby

Videos

Question
Book Icon
Chapter 5, Problem 17P

1.

To determine

Prepare rate of change analyses for the income statements and balance sheets of Company C for 2016 and 2017 using the year to year approach.

1.

Expert Solution
Check Mark

Explanation of Solution

Balance Sheet: Balance Sheet is one of the financial statements which summarize the assets, the liabilities, and the Shareholder’s equity of a company at a given date. It is also known as the statement of financial status of the business.

Income statement: The financial statement which reports revenues and expenses from business operations and the result of those operations as net income or net loss for a particular time period is referred to as income statement.

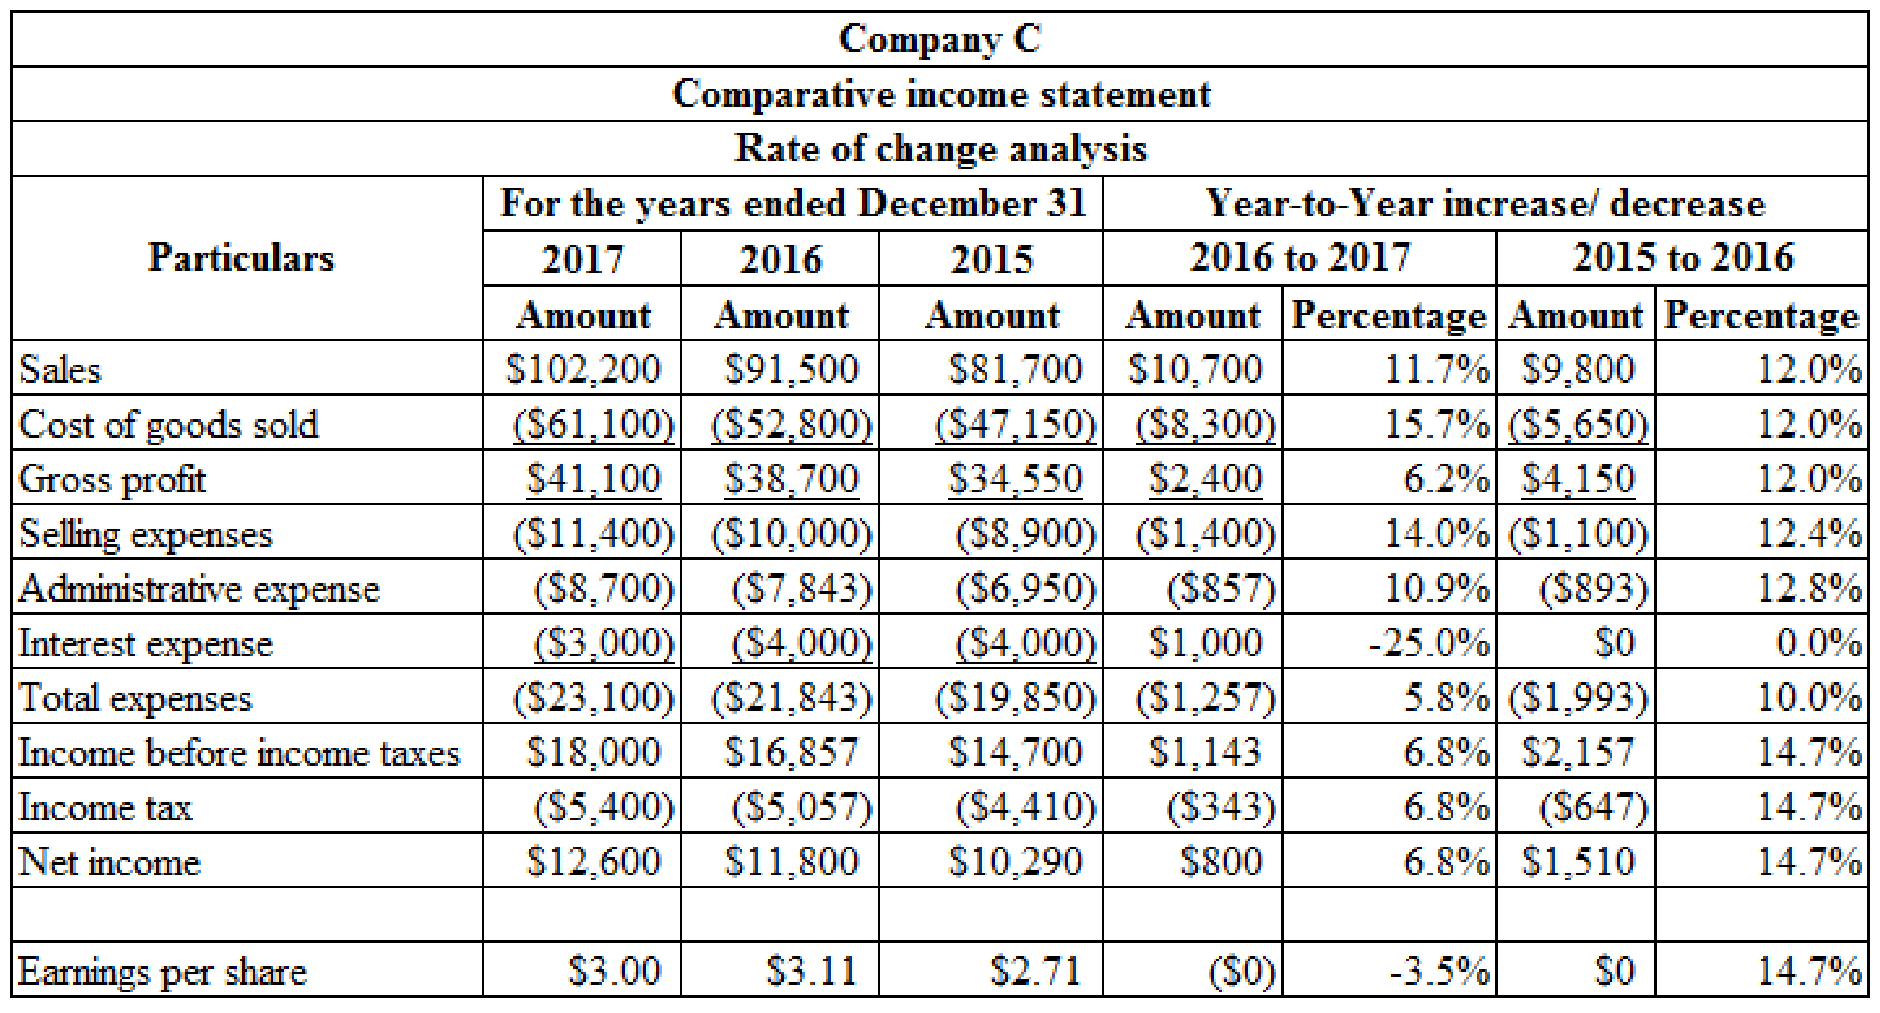
Prepare rate of change analyses for the income statements of Company C for 2016 and 2017 using the year to year approach:
Intermediate Accounting: Reporting and Analysis (Looseleaf), Chapter 5, Problem 17P , additional homework tip  1

Table (1)

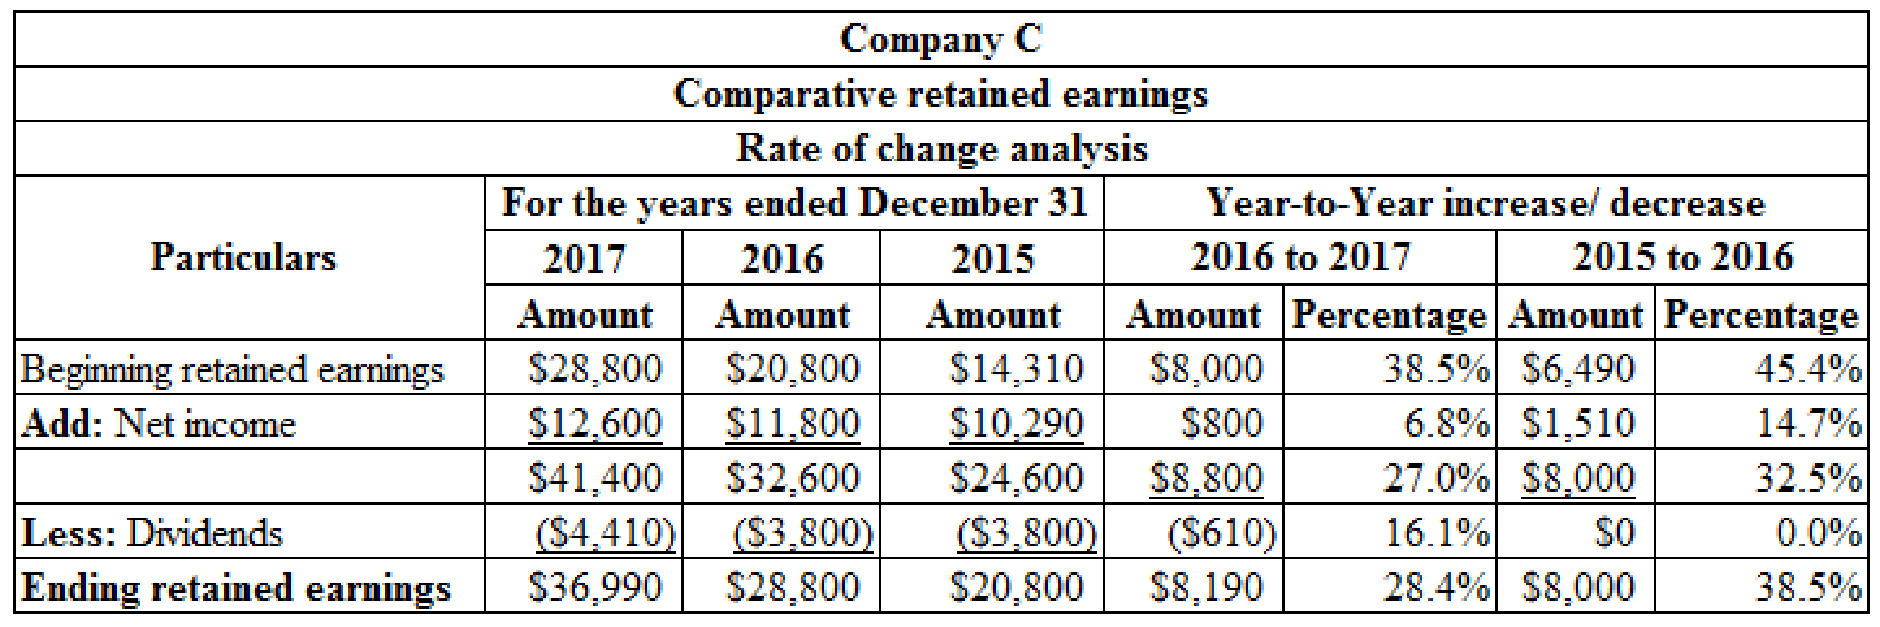
Prepare rate of change analyses for the retained earnings of Company C for 2016 and 2017 using the year to year approach:
Intermediate Accounting: Reporting and Analysis (Looseleaf), Chapter 5, Problem 17P , additional homework tip  2

Table (2)

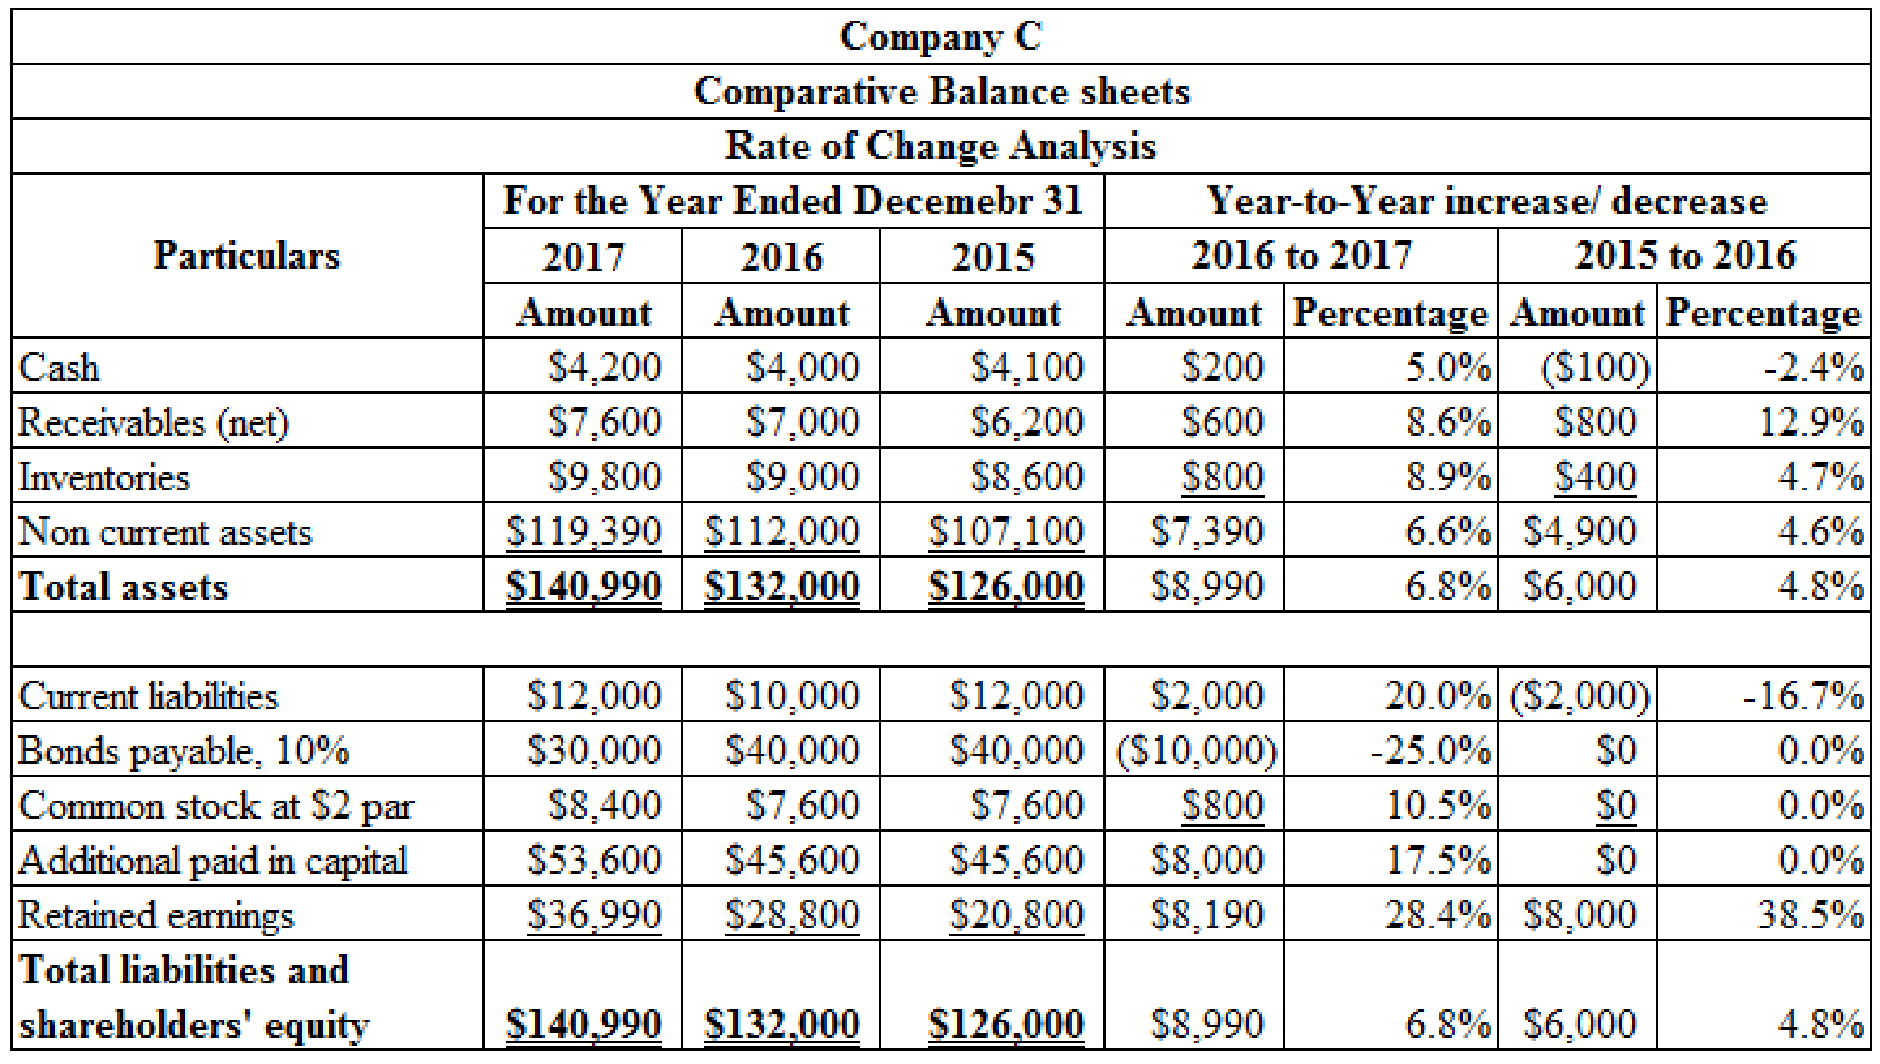
Prepare rate of change analyses for the balance sheets of Company C for 2016 and 2017 using the year to year approach:
Intermediate Accounting: Reporting and Analysis (Looseleaf), Chapter 5, Problem 17P , additional homework tip  3

Table (3)

2. (a)

To determine

Compute current ratio for 2016 and 2017.

2. (a)

Expert Solution
Check Mark

Explanation of Solution

Current ratio: Current ratio is one of the liquidity ratios, which measures the capacity of the company to meet its short-term obligations using its current assets. Current ratio is calculated by using the formula:

Current ratio=Current AssetsCurrent Liabilities

Compute current ratio for 2016 and 2017:

Ratios and Formula20172016

Current ratio:

Current AssetsCurrent Liabilities

=[(Cash+ Receivables + Inventories)Current liabilities]=($4,200+$7,600+$9,800)($12,000)=1.8:1 =[(Cash+ Receivables + Inventories)Current liabilities]=($4,000+$7,000+$9,000)($10,000)=2:1

Table (4)

2. (b)

To determine

Compute inventory turnover for 2016 and 2017.

2. (b)

Expert Solution
Check Mark

Explanation of Solution

Inventory Turnover Ratio: This ratio is a financial metric used by a company to quantify the number of times inventory is used or sold during the accounting period. It is calculated by using the formula:

Inventory turnover=Cost of goods soldAverage inventory

Compute inventory turnover for 2016 and 2017:

Ratios and Formula20172016

Inventory turnover:

Cost of goods soldAverage inventory

Average inventory:

(Ending Inventory)+(Beginning Inventory)2

=$61,100$9,400=6.5 times 

=[($9,000+$9,800)2]=$9,400

=$52,800$8,800=6 times 

=[($6,600+$9,000)2]=$8,800

Table (5)

2. (c)

To determine

Compute receivable turnover for 2016 and 2017.

2. (c)

Expert Solution
Check Mark

Explanation of Solution

Receivables turnover ratio: Receivables turnover ratio is mainly used to evaluate the collection process efficiency. It helps the company to know the number of times the accounts receivable is collected in a particular time period. This ratio is determined by dividing credit sales and average accounts receivables.

Receivables turnover=Net credit salesAverage accounts receivables

Compute receivable turnover for 2016 and 2017:

Ratios and Formula20172016

Receivables turnover:

Net credit sales(Average accounts receivables)

Average accounts receivable:

(Ending Net Receivables)+(Beginning Net Receivables)2

=$102,200×.60$7,300=8.4 times

=[($7,000+$7,600)2]=$7,300

=$91,500×.65$6,600=9.01 times

=[($6,200+$7,000)2]=$6,600

Table (6)

2. (d)

To determine

Compute net profit margin for 2016 and 2017.

2. (d)

Expert Solution
Check Mark

Explanation of Solution

Net profit margin: It is one of the profitability ratios. Profit margin ratio is used to measure the percentage of net income that is being generated per dollar of revenue or sales.

Net margin=Net incomeNet sales

Compute net profit margin for 2016 and 2017:

Ratios and Formula20172016

Net profit margin:

Net incomeNet sales

=($12,600$102,200×100)=12.33%=($11,800$91,500×100)=12.90%

Table (7)

2. (e)

To determine

Compute earnings per share for 2016 and 2017.

2. (e)

Expert Solution
Check Mark

Explanation of Solution

Earnings per Share: Earnings per share help to measure the profitability of a company. Earnings per share are the amount of profit that is allocated to each share of outstanding stock.

Earnings per share=Net earnings available for common stockAverage number of outstanding common shares

Compute earnings per share for 2016 and 2017:

Ratios and Formula20172016

Earnings per share:

Net incomePreferred dividend[Average common shares outstanding]

=($12,600$8,400$2×100)=$3=($11,800$7,600$2×100)=$3.11

Table (8)

2. (f)

To determine

Compute return on total assets ratio for 2016 and 2017.

2. (f)

Expert Solution
Check Mark

Explanation of Solution

Return on total assets: Return on investments (assets) is the financial ratio which determines the amount of net income earned by the business with the use of total assets owned by it. It indicates the magnitude of the company’s earnings with relative to its total assets. Return on investment is calculated as follows:

Return on asset=(Net income +(Interest expense×After tax rate))Average total assets×100

Compute return on total assets for 2016 and 2017:

Ratios and Formula20172016

Return on total assets:

[(Net income + (Interest expense×After tax rate))Average total assets×100]

Average total assets:

(Ending total assets)+(Beginning total assets)2

=[($12,600+($3,000×.7))$136,495×100]=[($12,600+$2,100)$136,495×100]=10.8%

=($132,000 +$140,990)2=$136,495

=[($11,800+($4,000×.7))$129,000×100]=[($11,800+$2,800)$129,000×100]=11.3%

=($126,000 +$132,000)2=$129,000

Table (9)

Working note: 1 Determine the after tax rate:

Ratios and Formula20172016

After tax rate:

[1( Income tax amount Income before tax)]

=[1($5,400$18,000)]=1.30=0.7=[1($5,057$16,857)]=1.30=0.7

Table (10)

2. (g)

To determine

Compute return on common stockholders’ equity for 2016 and 2017.

2. (g)

Expert Solution
Check Mark

Explanation of Solution

Return on common stockholders’ equity ratio: It is a profitability ratio that measures the profit generating ability of the company from the invested money of the shareholders. The formula to calculate the return on equity is as follows:

Return on common stockholders' equity}= Net incomeAverage stockholders' equity×100

Compute return on common stockholders’ equity for 2016 and 2017:

Ratios and Formula20172016

Return on common stockholders’ equity:

Net income [Average stockholders' equity]

Average stockholders’ equity:

(Ending stockholders' equity)+(Beginning stockholders' equity)2

=($12,600$90,495×100)=13.9%

=[($98,990+$82,000)2]=$90,495

=($11,800$78,000×100)=15.1%

=[($82,000+$74,000)2]=$78,000

Table (11)

2. (h)

To determine

Compute debt to assets for 2016 and 2017.

2. (h)

Expert Solution
Check Mark

Explanation of Solution

Debt to assets ratio: The debt to asset ratio shows the relationship between total asset and the total liability of the company. Debt ratio reflects the financial strategy of the company. It is used to measure the percentage of company’s assets that are financed by long term debts.  Debt to assets ratio is calculated by using the formula:

Debt-to-assets ratio=Total LiabilitiesTotal Assets 

Compute debt to assets for 2016 and 2017:

Ratios and Formula20172016

 Debt to assets ratio:

Total liabilities Total assets

=$12,000+$30,000$140,990×100=29.8%=$10,000+$40,000$132,000×100=37.9%

Table (12)

3.

To determine

Explain the possible reasons for the decrease in the market price per share in 2017.

3.

Expert Solution
Check Mark

Explanation of Solution

The probable reason for the decrease in the market price per share in 2017:

  • The  current ratio, receivable turnover ratio, net profit margin ratio, return on total assets, return on shareholders’ equity and earnings per share ratio in year 2017 are less than the result provided in the year of 2016.
  • The financial condition of the company is not as strong as it was in 2016 because earnings per share of Company C have decreased from $3.11(2016) to $3 (2017) and the debt to assets ratio has also decreased from 37.9% (2016) to $29.8% (2017).

Want to see more full solutions like this?

Subscribe now to access step-by-step solutions to millions of textbook problems written by subject matter experts!
Students have asked these similar questions
Give me answer general accounting question
Lucy Company, Inc. had $812,000 in sales, sales discounts of $12,180, sales returns and allowances of $18,270, cost of goods sold of $385,700, and $279,330 in operating expenses. Gross profit equals?
Financial accounting question

Chapter 5 Solutions

Intermediate Accounting: Reporting and Analysis (Looseleaf)

Ch. 5 - Define expenses. What do expenses measure?Ch. 5 - Prob. 12GICh. 5 - Define gains and losses. Give examples of three...Ch. 5 - Prob. 14GICh. 5 - What items are included in a companys income from...Ch. 5 - How are unusual or infrequent gains or losses...Ch. 5 - What is interperiod tax allocation?Ch. 5 - Prob. 18GICh. 5 - Prob. 19GICh. 5 - Prob. 20GICh. 5 - Prob. 21GICh. 5 - Prob. 22GICh. 5 - Prob. 23GICh. 5 - Prob. 24GICh. 5 - Prob. 25GICh. 5 - Prob. 26GICh. 5 - Prob. 27GICh. 5 - Prob. 28GICh. 5 - Prob. 29GICh. 5 - Prob. 30GICh. 5 - Prob. 31GICh. 5 - Prob. 32GICh. 5 - What is the rate of return on common equity? What...Ch. 5 - Prob. 34GICh. 5 - Prob. 35GICh. 5 - Which of the following is expensed under the...Ch. 5 - The following information is available for Cooke...Ch. 5 - The following information is available for Wagner...Ch. 5 - Prob. 4MCCh. 5 - A loss from the sale of a component of a business...Ch. 5 - In a statement of cash flows, receipts from sales...Ch. 5 - Brandt Corporation had sales revenue of 500,000...Ch. 5 - Refer to RE5-1. Prepare a single-step income...Ch. 5 - Shaquille Corporation began the current year with...Ch. 5 - Dorno Corporation incurred expenses during the...Ch. 5 - Niler Corporation reported the following after-tax...Ch. 5 - Jordan Corporation reported retained earnings of...Ch. 5 - Prob. 7RECh. 5 - Prob. 8RECh. 5 - Amelias Bookstore reported net income of 62,000...Ch. 5 - Prob. 10RECh. 5 - Prob. 1ECh. 5 - Prob. 2ECh. 5 - Prob. 3ECh. 5 - Cost of Goods Sold and Income Statement Schuch...Ch. 5 - Prob. 5ECh. 5 - Prob. 6ECh. 5 - Prob. 7ECh. 5 - Prob. 8ECh. 5 - Prob. 9ECh. 5 - Prob. 10ECh. 5 - Prob. 11ECh. 5 - Prob. 12ECh. 5 - Prob. 13ECh. 5 - Prob. 14ECh. 5 - Prob. 15ECh. 5 - Prob. 16ECh. 5 - Prob. 17ECh. 5 - Classifications Where would each of the following...Ch. 5 - Prob. 19ECh. 5 - Common-Size Analyses Meagley Company presents the...Ch. 5 - Prob. 21ECh. 5 - Prob. 22ECh. 5 - Prob. 23ECh. 5 - Prob. 24ECh. 5 - Prob. 25ECh. 5 - Prob. 26ECh. 5 - Prob. 1PCh. 5 - Prob. 2PCh. 5 - Prob. 3PCh. 5 - Prob. 4PCh. 5 - Financial Statement Violations of U.S. GAAP The...Ch. 5 - Rox Corporations multiple-step income statement...Ch. 5 - Prob. 7PCh. 5 - Prob. 8PCh. 5 - Prob. 9PCh. 5 - The following is an alphabetical list of accounts...Ch. 5 - Financial Statement Deficiencies The following is...Ch. 5 - Prob. 12PCh. 5 - Prob. 13PCh. 5 - Prob. 14PCh. 5 - Prob. 15PCh. 5 - Prob. 16PCh. 5 - Prob. 17PCh. 5 - Prob. 18PCh. 5 - Prob. 19PCh. 5 - Prob. 20PCh. 5 - Prob. 21PCh. 5 - Prob. 22PCh. 5 - Prob. 23PCh. 5 - Prob. 1CCh. 5 - Prob. 2CCh. 5 - Prob. 3CCh. 5 - Prob. 4CCh. 5 - Nonrecurring Items Lynn Company sells a component...Ch. 5 - Prob. 6CCh. 5 - Accrual Accounting GAAP requires the use of...Ch. 5 - Prob. 8CCh. 5 - Prob. 9CCh. 5 - Prob. 10CCh. 5 - Prob. 12C
Knowledge Booster
Background pattern image
Accounting
Learn more about
Need a deep-dive on the concept behind this application? Look no further. Learn more about this topic, accounting and related others by exploring similar questions and additional content below.
Recommended textbooks for you
Text book image
Intermediate Accounting: Reporting And Analysis
Accounting
ISBN:9781337788281
Author:James M. Wahlen, Jefferson P. Jones, Donald Pagach
Publisher:Cengage Learning
Text book image
Financial Accounting
Accounting
ISBN:9781305088436
Author:Carl Warren, Jim Reeve, Jonathan Duchac
Publisher:Cengage Learning
Text book image
PFIN (with PFIN Online, 1 term (6 months) Printed...
Finance
ISBN:9781337117005
Author:Randall Billingsley, Lawrence J. Gitman, Michael D. Joehnk
Publisher:Cengage Learning
Text book image
Financial Accounting: The Impact on Decision Make...
Accounting
ISBN:9781305654174
Author:Gary A. Porter, Curtis L. Norton
Publisher:Cengage Learning
Text book image
Corporate Fin Focused Approach
Finance
ISBN:9781285660516
Author:EHRHARDT
Publisher:Cengage
Text book image
EBK CONTEMPORARY FINANCIAL MANAGEMENT
Finance
ISBN:9781337514835
Author:MOYER
Publisher:CENGAGE LEARNING - CONSIGNMENT
Financial ratio analysis; Author: The Finance Storyteller;https://www.youtube.com/watch?v=MTq7HuvoGck;License: Standard Youtube License