In the theory of biorhythms, sine functions are used to measure a person's potential. You can obtain your biorhythm chart online by simply entering your date of birth, the date you want your biorhythm chart to begin, and the number of months you wish to have included in the plot. Shown below is your author's chart, beginning January' 25,2015. when he was 25,473 days old. We all have cycles with the same amplitudes and periods as those shown here. Each of our three basic cycles begins at birth. Use the biorhythm chart shown to solve Exercises 75-82. The longer tick marks correspond to the dates shown. For the period shown, what is the worst day in February for your author to run in a marathon?
In the theory of biorhythms, sine functions are used to measure a person's potential. You can obtain your biorhythm chart online by simply entering your date of birth, the date you want your biorhythm chart to begin, and the number of months you wish to have included in the plot. Shown below is your author's chart, beginning January' 25,2015. when he was 25,473 days old. We all have cycles with the same amplitudes and periods as those shown here. Each of our three basic cycles begins at birth. Use the biorhythm chart shown to solve Exercises 75-82. The longer tick marks correspond to the dates shown. For the period shown, what is the worst day in February for your author to run in a marathon?
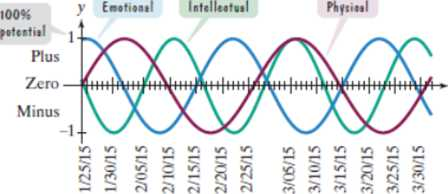
Solution Summary: The author calculates the worst day in February to run a marathon from the biorhythm chart given below.
In the theory of biorhythms, sine functions are used to measure a person's potential. You can obtain your biorhythm chart online by simply entering your date of birth, the date you want your biorhythm chart to begin, and the number of months you wish to have included in the plot. Shown below is your author's chart, beginning January' 25,2015. when he was 25,473 days old. We all have cycles with the same amplitudes and periods as those shown here. Each of our three basic cycles begins at birth. Use the biorhythm chart shown to solve Exercises 75-82. The longer tick marks correspond to the dates shown.
For the period shown, what is the worst day in February for your author to run in a marathon?
Consider the function f(x) = x²-1.
(a) Find the instantaneous rate of change of f(x) at x=1 using the definition of the derivative.
Show all your steps clearly.
(b) Sketch the graph of f(x) around x = 1. Draw the secant line passing through the points on the
graph where x 1 and x->
1+h (for a small positive value of h, illustrate conceptually). Then,
draw the tangent line to the graph at x=1. Explain how the slope of the tangent line relates to the
value you found in part (a).
(c) In a few sentences, explain what the instantaneous rate of change of f(x) at x = 1 represents in
the context of the graph of f(x). How does the rate of change of this function vary at different
points?
1. The graph of ƒ is given. Use the graph to evaluate each of the following values. If a value does not exist,
state that fact.
и
(a) f'(-5)
(b) f'(-3)
(c) f'(0)
(d) f'(5)
2. Find an equation of the tangent line to the graph of y = g(x) at x = 5 if g(5) = −3 and g'(5)
=
4.
-
3. If an equation of the tangent line to the graph of y = f(x) at the point where x 2 is y = 4x — 5, find ƒ(2)
and f'(2).
Does the series converge or diverge
Chapter 4 Solutions
MyLab Math with Pearson eText -- Standalone Access Card -- for Precalculus (6th Edition)
Need a deep-dive on the concept behind this application? Look no further. Learn more about this topic, calculus and related others by exploring similar questions and additional content below.


 College AlgebraAlgebraISBN:9781305115545Author:James Stewart, Lothar Redlin, Saleem WatsonPublisher:Cengage Learning
 Holt Mcdougal Larson Pre-algebra: Student Edition...AlgebraISBN:9780547587776Author:HOLT MCDOUGALPublisher:HOLT MCDOUGAL
 Trigonometry (MindTap Course List)TrigonometryISBN:9781305652224Author:Charles P. McKeague, Mark D. TurnerPublisher:Cengage Learning
 Algebra: Structure And Method, Book 1AlgebraISBN:9780395977224Author:Richard G. Brown, Mary P. Dolciani, Robert H. Sorgenfrey, William L. ColePublisher:McDougal Littell
 Elementary AlgebraAlgebraISBN:9780998625713Author:Lynn Marecek, MaryAnne Anthony-SmithPublisher:OpenStax - Rice University