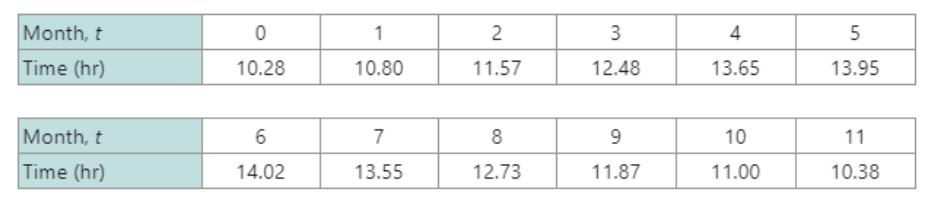
The data in the table represent the duration of daylight d t (in hours) for Houston, Texas, for the first day of the month, t months after January 1 for a recent year. a. Enter the data in a graphing utility and use the sinusoidal regression tool (SinReg) to find a model of the form d t = a sin b t + c + d . b. Graph the data and the resulting function.
The data in the table represent the duration of daylight d t (in hours) for Houston, Texas, for the first day of the month, t months after January 1 for a recent year. a. Enter the data in a graphing utility and use the sinusoidal regression tool (SinReg) to find a model of the form d t = a sin b t + c + d . b. Graph the data and the resulting function.
Solution Summary: The author calculates a model of the form d(t)=amathrmsin (bt+c )+d for the given data by using
The data in the table represent the duration of daylight
d
t
(in hours) for Houston, Texas, for the first day of the month,
t
months after January
1
for a recent year.
a. Enter the data in a graphing utility and use the sinusoidal regression tool (SinReg) to find a model of the form
d
t
=
a
sin
b
t
+
c
+
d
.
Consider the function f(x) = x²-1.
(a) Find the instantaneous rate of change of f(x) at x=1 using the definition of the derivative.
Show all your steps clearly.
(b) Sketch the graph of f(x) around x = 1. Draw the secant line passing through the points on the
graph where x 1 and x->
1+h (for a small positive value of h, illustrate conceptually). Then,
draw the tangent line to the graph at x=1. Explain how the slope of the tangent line relates to the
value you found in part (a).
(c) In a few sentences, explain what the instantaneous rate of change of f(x) at x = 1 represents in
the context of the graph of f(x). How does the rate of change of this function vary at different
points?
1. The graph of ƒ is given. Use the graph to evaluate each of the following values. If a value does not exist,
state that fact.
и
(a) f'(-5)
(b) f'(-3)
(c) f'(0)
(d) f'(5)
2. Find an equation of the tangent line to the graph of y = g(x) at x = 5 if g(5) = −3 and g'(5)
=
4.
-
3. If an equation of the tangent line to the graph of y = f(x) at the point where x 2 is y = 4x — 5, find ƒ(2)
and f'(2).
Using and Understanding Mathematics: A Quantitative Reasoning Approach (6th Edition)
Knowledge Booster
Learn more about
Need a deep-dive on the concept behind this application? Look no further. Learn more about this topic, calculus and related others by exploring similar questions and additional content below.
Correlation Vs Regression: Difference Between them with definition & Comparison Chart; Author: Key Differences;https://www.youtube.com/watch?v=Ou2QGSJVd0U;License: Standard YouTube License, CC-BY
Correlation and Regression: Concepts with Illustrative examples; Author: LEARN & APPLY : Lean and Six Sigma;https://www.youtube.com/watch?v=xTpHD5WLuoA;License: Standard YouTube License, CC-BY


 Algebra & Trigonometry with Analytic GeometryAlgebraISBN:9781133382119Author:SwokowskiPublisher:Cengage
 Trigonometry (MindTap Course List)TrigonometryISBN:9781337278461Author:Ron LarsonPublisher:Cengage Learning