
Concept explainers
Videos
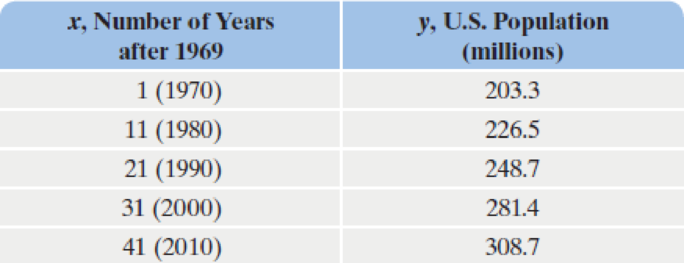
In Example 1 on page 520, we used two data points and an exponential function to model the population of the United States from 1970 through 2010. The data are shown again in the table. Use all five data points to solve Exercises 66–70.
66.
- a. Use your graphing utility’s exponential regression option to obtain a model of the form y = abx that fits the data. How well does the
correlation coefficient , r, indicate that the model fits the data? - b. Rewrite the model in terms of base e. By what percentage is the population of the United States increasing each year?
67. Use your graphing utility’s logarithmic regression option to obtain a model of the form y = a + b ln x that fits the data. How well does the correlation coefficient, r, indicate that the model fits the data?
68. Use your graphing utility’s linear regression option to obtain a model of the form y = ax + b that fits the data. How well does the correlation coefficient, r, indicate that the model fits the data?
69. Use your graphing utility’s power regression option to obtain a model of the form y = axb that fits the data. How well does the correlation coefficient, r, indicate that the model fits the data?
70. Use the values of r in Exercises 66–69 to select the two models of best fit. Use each of these models to predict by which year the U.S. population will reach 335 million. How do these answers compare to the year we found in Example 1, namely 2020? If you obtained different years, how do you account for this difference?
Want to see the full answer?
Check out a sample textbook solution
Chapter 4 Solutions
COLLEGE ALGEBRA ESSENTIALS - 18 WEEK MM


- please Solve questions by Course Name( Ordinary Differential Equations II 2)arrow_forwardInThe Northern Lights are bright flashes of colored light between 50 and 200 miles above Earth. Suppose a flash occurs 150 miles above Earth. What is the measure of arc BD, the portion of Earth from which the flash is visible? (Earth’s radius is approximately 4000 miles.)arrow_forwarde). n! (n - 1)!arrow_forward
- Suppose you flip a fair two-sided coin four times and record the result. a). List the sample space of this experiment. That is, list all possible outcomes that could occur when flipping a fair two-sided coin four total times. Assume the two sides of the coin are Heads (H) and Tails (T).arrow_forwarde). n! (n - 1)!arrow_forwardEvaluate the following expression and show your work to support your calculations. a). 6! b). 4! 3!0! 7! c). 5!2! d). 5!2! e). n! (n - 1)!arrow_forward
- Amy and Samiha have a hat that contains two playing cards, one ace and one king. They are playing a game where they randomly pick a card out of the hat four times, with replacement. Amy thinks that the probability of getting exactly two aces in four picks is equal to the probability of not getting exactly two aces in four picks. Samiha disagrees. She thinks that the probability of not getting exactly two aces is greater. The sample space of possible outcomes is listed below. A represents an ace, and K represents a king. Who is correct?arrow_forwardConsider the exponential function f(x) = 12x. Complete the sentences about the key features of the graph. The domain is all real numbers. The range is y> 0. The equation of the asymptote is y = 0 The y-intercept is 1arrow_forwardThe graph shows Alex's distance from home after biking for x hours. What is the average rate of change from -1 to 1 for the function? 4-2 о A. -2 О B. 2 О C. 1 O D. -1 ty 6 4 2 2 0 X 2 4arrow_forward
 Glencoe Algebra 1, Student Edition, 9780079039897...AlgebraISBN:9780079039897Author:CarterPublisher:McGraw Hill
 Algebra & Trigonometry with Analytic GeometryAlgebraISBN:9781133382119Author:SwokowskiPublisher:Cengage