
Concept explainers
Videos
Use Table 4, Appendix 3, to find the following
a P(0 ≤ Z ≤ 1.2)
b P(−.9 ≤ Z ≤ 0)
c P(.3 ≤ Z ≤ 1.56)
d P(−.2 ≤ Z ≤ .2)
e P(−1.56 ≤ Z ≤ −.2)
f Applet Exercise Use the applet Normal Probabilities to obtain P(0 ≤ Z ≤ 1.2). Why are the values given on the two horizontal axes identical?
a.
Find the value of
Answer to Problem 58E
The value of
Explanation of Solution
Calculation:
It is given that Z is normally distributed with mean 0 and standard deviation 1.
The following can be observed for Z:
Since, the standard normal distribution is symmetric about 0,
Use Table 4: Normal Curve Areas Standard normal probability in right-hand tail to obtain the probability as follows:
- Locate 0.0 along the z column.
- Locate 0 along the Second decimal place of z.
- The intersection of row and column gives the probability value of 0.5000.
Use Table 4: Normal Curve Areas Standard normal probability in right-hand tail to obtain the probability as follows:
- Locate 1.2 along the z column
- Locate 0 along the Second decimal place of z
- The intersection of row and column gives the probability value of 0.1151.
Thus, the value of
b.
Find the value of
Answer to Problem 58E
The value of
Explanation of Solution
Calculation:
The following can be observed for Z:
Since, the standard normal distribution is symmetric about 0,
Use Table 4: Normal Curve Areas Standard normal probability in right-hand tail to obtain the probability as follows:
- Locate 0.0 along the z column.
- Locate 0 along the Second decimal place of z.
- The intersection of row and column gives the probability value of 0.5000.
Use Table 4: Normal Curve Areas Standard normal probability in right-hand tail to obtain the probability as follows:
- Locate 0.9 along the z column.
- Locate 0 along the Second decimal place of z.
- The intersection of row and column gives the probability value of 0.1841.
Thus, the value of
c.
Find the value of
Answer to Problem 58E
The value of
Explanation of Solution
Calculation:
The following can be observed for Z:
Use Table 4: Normal Curve Areas Standard normal probability in right-hand tail to obtain the probability as follows:
- Locate 0.3 along the z column
- Locate 0 along the Second decimal place of z
- The intersection of row and column gives the probability value of 0.3821.
Use Table 4: Normal Curve Areas Standard normal probability in right-hand tail to obtain the probability as follows:
- Locate 1.5 along the z column
- Locate 6 along the Second decimal place of z
- The intersection of row and column gives the probability value of 0.0594.
Thus, The value of
d.
Find the value of
Answer to Problem 58E
The value of
Explanation of Solution
Calculation:
The following can be observed for Z:
Since, the standard normal distribution is symmetric about 0,
Use Table 4: Normal Curve Areas Standard normal probability in right-hand tail to obtain the probability as follows:
- Locate 0.2 along the z column
- Locate 0 along the Second decimal place of z
- The intersection of row and column gives the probability value of 0.4207.
Thus, the value of
e.
Find the value of
Answer to Problem 58E
The value of
Explanation of Solution
Calculation:
The following can be observed for Z:
Since, the standard normal distribution is symmetric about 0,
Use Table 4: Normal Curve Areas Standard normal probability in right-hand tail to obtain the probability as follows:
- Locate 0.2 along the z column
- Locate 0 along the Second decimal place of z
- The intersection of row and column gives the probability value of 0.4207.
Use Table 4: Normal Curve Areas Standard normal probability in right-hand tail to obtain the probability as follows:
- Locate 1.5 along the z column
- Locate 6 along the Second decimal place of z
- The intersection of row and column gives the probability value of 0.0594.
Thus, The value of
f.
Find the value of
Explain the values given on the two horizontal axes identical or not.
Answer to Problem 58E
The value of
Explanation of Solution
Calculation:
The following can be observed for Z:
Step-by-step procedure to obtain the probability value using Applets as follows:
- Enter Mean = 0 and StDev = 1 values in the provided boxes.
- Enter Start = 0 and End = 1.2 value in the provided boxes.
Output obtained using Applets software is represented as follows:
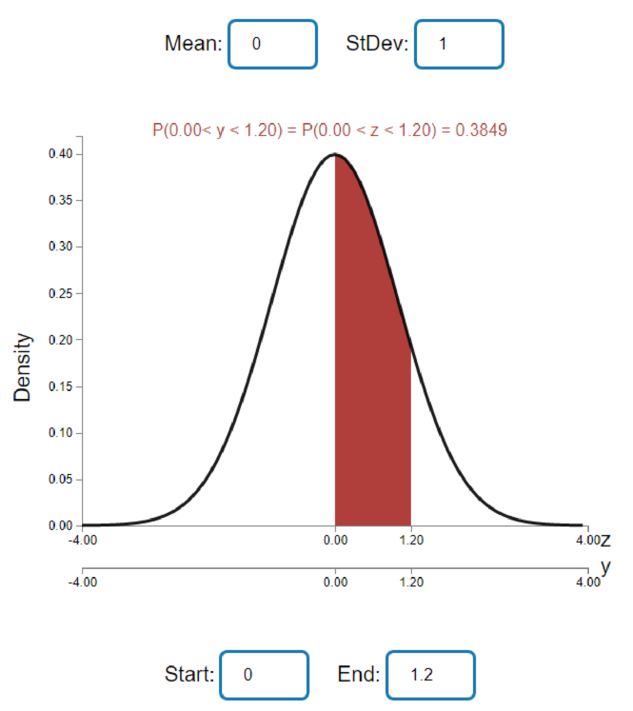
From the above output, the value of
Thus, the value of
Explanation:
The values given on the two horizontal axes are identical. It is because, in the above output the top Z axes represent the standard normal variable and they y axes represents the variable of interest. In the given situation the standard normal variable is only used. Hence as a result the both axes provide the same Z value of
Want to see more full solutions like this?
Chapter 4 Solutions
Mathematical Statistics with Applications


- Find the critical value for a left-tailed test using the F distribution with a 0.025, degrees of freedom in the numerator=12, and degrees of freedom in the denominator = 50. A portion of the table of critical values of the F-distribution is provided. Click the icon to view the partial table of critical values of the F-distribution. What is the critical value? (Round to two decimal places as needed.)arrow_forwardA retail store manager claims that the average daily sales of the store are $1,500. You aim to test whether the actual average daily sales differ significantly from this claimed value. You can provide your answer by inserting a text box and the answer must include: Null hypothesis, Alternative hypothesis, Show answer (output table/summary table), and Conclusion based on the P value. Showing the calculation is a must. If calculation is missing,so please provide a step by step on the answers Numerical answers in the yellow cellsarrow_forwardShow all workarrow_forward
- Show all workarrow_forwardplease find the answers for the yellows boxes using the information and the picture belowarrow_forwardA marketing agency wants to determine whether different advertising platforms generate significantly different levels of customer engagement. The agency measures the average number of daily clicks on ads for three platforms: Social Media, Search Engines, and Email Campaigns. The agency collects data on daily clicks for each platform over a 10-day period and wants to test whether there is a statistically significant difference in the mean number of daily clicks among these platforms. Conduct ANOVA test. You can provide your answer by inserting a text box and the answer must include: also please provide a step by on getting the answers in excel Null hypothesis, Alternative hypothesis, Show answer (output table/summary table), and Conclusion based on the P value.arrow_forward
 Holt Mcdougal Larson Pre-algebra: Student Edition...AlgebraISBN:9780547587776Author:HOLT MCDOUGALPublisher:HOLT MCDOUGAL
 Algebra & Trigonometry with Analytic GeometryAlgebraISBN:9781133382119Author:SwokowskiPublisher:Cengage