
Biological Science (7th Edition)
7th Edition
ISBN: 9780134678320
Author: Scott Freeman, Kim Quillin, Lizabeth Allison, Michael Black, Greg Podgorski, Emily Taylor, Jeff Carmichael
Publisher: PEARSON
expand_more
expand_more
format_list_bulleted
Concept explainers
Videos
Question
Chapter 44, Problem 9TYPSS
Summary Introduction
To review:
The existence of the pheromones on the basis of the data provided in the question.
Introduction:
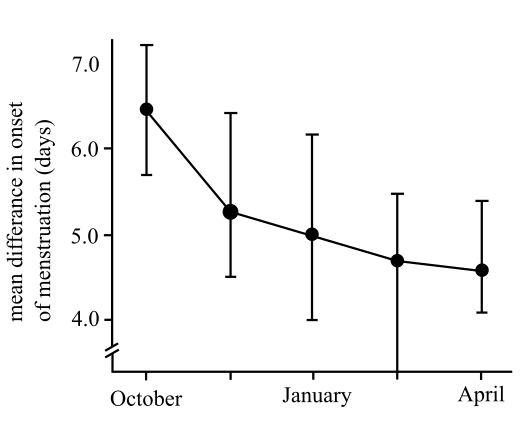
The regular natural changes that occur in the reproductive system of women, specifically in the ovaries and uterus, are referred to as menstrual cycle. These events are necessary for the pregnancy to occur in women.
The graph given in the problem provides the data on the date of onset of the menstrual cycle of a group of women. The y-axis of the graph represents the mean difference between the onset of a particular woman’s menstrual cycle and the average onset date of the rest of the women, while the x-axis represents the time period.
Expert Solution & Answer
Want to see the full answer?
Check out a sample textbook solution
Students have asked these similar questions
Ch.23
How is Salmonella able to cross from the intestines into the blood?
A. it is so small that it can squeeze between intestinal cells
B. it secretes a toxin that induces its uptake into intestinal epithelial cells
C. it secretes enzymes that create perforations in the intestine
D. it can get into the blood only if the bacteria are deposited directly there, that is, through a puncture
—
Which virus is associated with liver cancer?
A. hepatitis A
B. hepatitis B
C. hepatitis C
D. both hepatitis B and C
—
explain your answer thoroughly
Ch.21
What causes patients infected with the yellow fever virus to turn yellow (jaundice)?
A. low blood pressure and anemia
B. excess leukocytes
C. alteration of skin pigments
D. liver damage in final stage of disease
—
What is the advantage for malarial parasites to grow and replicate in red blood cells?
A. able to spread quickly
B. able to avoid immune detection
C. low oxygen environment for growth
D. cooler area of the body for growth
—
Which microbe does not live part of its lifecycle outside humans?
A. Toxoplasma gondii
B. Cytomegalovirus
C. Francisella tularensis
D. Plasmodium falciparum
—
explain your answer thoroughly
Ch.22
Streptococcus pneumoniae has a capsule to protect it from killing by alveolar macrophages, which kill bacteria by…
A. cytokines
B. antibodies
C. complement
D. phagocytosis
—
What fact about the influenza virus allows the dramatic antigenic shift that generates novel strains?
A. very large size
B. enveloped
C. segmented genome
D. over 100 genes
—
explain your answer thoroughly
Chapter 44 Solutions
Biological Science (7th Edition)
Ch. 44 - 1. In the human ear, how do different hair cells...Ch. 44 - What type of sensory system do migrating birds use...Ch. 44 - Considering that sounds and odors both trigger...Ch. 44 - Prob. 6TYUCh. 44 - 7. Compare and contrast the lateral line system of...Ch. 44 - Prob. 8TYUCh. 44 - Prob. 9TYPSSCh. 44 - PROCESS OF SCIENCE Design experiments to test the...Ch. 44 - Prob. 12PIATCh. 44 - Prob. 13PIAT
Knowledge Booster


Learn more about
Need a deep-dive on the concept behind this application? Look no further. Learn more about this topic, biology and related others by exploring similar questions and additional content below.Similar questions
- What is this?arrow_forwardMolecular Biology A-C components of the question are corresponding to attached image labeled 1. D component of the question is corresponding to attached image labeled 2. For a eukaryotic mRNA, the sequences is as follows where AUGrepresents the start codon, the yellow is the Kozak sequence and (XXX) just represents any codonfor an amino acid (no stop codons here). G-cap and polyA tail are not shown A. How long is the peptide produced?B. What is the function (a sentence) of the UAA highlighted in blue?C. If the sequence highlighted in blue were changed from UAA to UAG, how would that affecttranslation? D. (1) The sequence highlighted in yellow above is moved to a new position indicated below. Howwould that affect translation? (2) How long would be the protein produced from this new mRNA? Thank youarrow_forwardMolecular Biology Question Explain why the cell doesn’t need 61 tRNAs (one for each codon). Please help. Thank youarrow_forward
- Molecular Biology You discover a disease causing mutation (indicated by the arrow) that alters splicing of its mRNA. This mutation (a base substitution in the splicing sequence) eliminates a 3’ splice site resulting in the inclusion of the second intron (I2) in the final mRNA. We are going to pretend that this intron is short having only 15 nucleotides (most introns are much longer so this is just to make things simple) with the following sequence shown below in bold. The ( ) indicate the reading frames in the exons; the included intron 2 sequences are in bold. A. Would you expected this change to be harmful? ExplainB. If you were to do gene therapy to fix this problem, briefly explain what type of gene therapy youwould use to correct this. Please help. Thank youarrow_forwardMolecular Biology Question Please help. Thank you Explain what is meant by the term “defective virus.” Explain how a defective virus is able to replicate.arrow_forwardMolecular Biology Explain why changing the codon GGG to GGA should not be harmful. Please help . Thank youarrow_forward
- Stage Percent Time in Hours Interphase .60 14.4 Prophase .20 4.8 Metaphase .10 2.4 Anaphase .06 1.44 Telophase .03 .72 Cytukinesis .01 .24 Can you summarize the results in the chart and explain which phases are faster and why the slower ones are slow?arrow_forwardCan you circle a cell in the different stages of mitosis? 1.prophase 2.metaphase 3.anaphase 4.telophase 5.cytokinesisarrow_forwardWhich microbe does not live part of its lifecycle outside humans? A. Toxoplasma gondii B. Cytomegalovirus C. Francisella tularensis D. Plasmodium falciparum explain your answer thoroughly.arrow_forward
- Select all of the following that the ablation (knockout) or ectopoic expression (gain of function) of Hox can contribute to. Another set of wings in the fruit fly, duplication of fingernails, ectopic ears in mice, excess feathers in duck/quail chimeras, and homeosis of segment 2 to jaw in Hox2a mutantsarrow_forwardSelect all of the following that changes in the MC1R gene can lead to: Changes in spots/stripes in lizards, changes in coat coloration in mice, ectopic ear formation in Siberian hamsters, and red hair in humansarrow_forwardPleiotropic genes are genes that (blank) Cause a swapping of organs/structures, are the result of duplicated sets of chromosomes, never produce protein products, and have more than one purpose/functionarrow_forward
arrow_back_ios
SEE MORE QUESTIONS
arrow_forward_ios
Recommended textbooks for you
 Concepts of BiologyBiologyISBN:9781938168116Author:Samantha Fowler, Rebecca Roush, James WisePublisher:OpenStax College
 Biology (MindTap Course List)BiologyISBN:9781337392938Author:Eldra Solomon, Charles Martin, Diana W. Martin, Linda R. BergPublisher:Cengage Learning
 Human Physiology: From Cells to Systems (MindTap ...BiologyISBN:9781285866932Author:Lauralee SherwoodPublisher:Cengage Learning
Concepts of Biology
Biology
ISBN:9781938168116
Author:Samantha Fowler, Rebecca Roush, James Wise
Publisher:OpenStax College
Biology (MindTap Course List)
Biology
ISBN:9781337392938
Author:Eldra Solomon, Charles Martin, Diana W. Martin, Linda R. Berg
Publisher:Cengage Learning
Human Physiology: From Cells to Systems (MindTap ...
Biology
ISBN:9781285866932
Author:Lauralee Sherwood
Publisher:Cengage Learning
Animal Communication | Ecology & Environment | Biology | FuseSchool; Author: FuseSchool - Global Education;https://www.youtube.com/watch?v=LsMbn3b1Bis;License: Standard Youtube License