Concept explainers
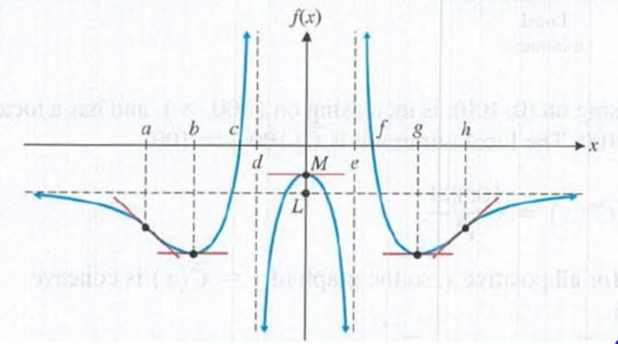
Use the graph of f in the figure to identify the following (assume that f"(0) < 0 f"(b) > 0, and f"(g) > 0):

(A) the intervals on which f'(x)<0
(B) the intervals on which f'(x) > 0
(C) the intervals on which f(x) is increasing
(D) the intervals on which f(x) is decreasing
(E) the .v coordinate(s) of the point(s) where f (x) has a
(F) the x coordinate(s) of the point(s) where f(x) has a
(G) the intervals on which f"(x) < 0
(H) the intervals on which f"(x) > 0
(I) the intervals on which the graph of f is concave upward
(J) the intervals on which the graph of f is concave downward
(K) the .v coordinate(s) of the inflection point(s)
(L) the horizontal asymptote(s)
(M) the vertical asymptote(s)
Want to see the full answer?
Check out a sample textbook solution
Chapter 4 Solutions
Calculus for Business Economics Life Sciences and Social Sciences Plus NEW
- 1) Find the partial feraction decomposition for each of 5- X 2 2x+x-1 The following: 3 B) 3 X + 3xarrow_forwardUse the information in the following table to find h' (a) at the given value for a. x|f(x) g(x) f'(x) g(x) 0 0 0 4 3 1 4 4 3 0 2 7 1 2 7 3 3 1 2 9 4 0 4 5 7 h(x) = f(g(x)); a = 0 h' (0) =arrow_forwardUse the information in the following table to find h' (a) at the given value for a. x f(x) g(x) f'(x) g'(x) 0 0 3 2 1 1 0 0 2 0 2 43 22 4 3 3 2 3 1 1 4 1 2 0 4 2 h(x) = (1/(2) ²; 9(x) h' (3)= = ; a=3arrow_forward
- The position of a moving hockey puck after t seconds is s(t) = tan a. Find the velocity of the hockey puck at any time t. v(t) ===== b. Find the acceleration of the puck at any time t. -1 a (t) = (t) where s is in meters. c. Evaluate v(t) and a (t) for t = 1, 4, and 5 seconds. Round to 4 decimal places, if necessary. v (1) v (4) v (5) a (1) = = = = a (4) = a (5) = d. What conclusion can be drawn from the results in the previous part? ○ The hockey puck is decelerating/slowing down at 1, 4, and 5 seconds ○ The hockey puck has a constant velocity/speed at 1, 4, and 5 seconds ○ The hockey puck is accelerating/speeding up at 1, 4, and 5 secondsarrow_forwardIf the average price of a new one family home is $246,300 with a standard deviation of $15,000 find the minimum and maximum prices of the houses that a contractor will build to satisfy 88% of the market valuearrow_forwardT={(−7,1),(1,−1),(6,−8),(2,8)} Find the domain and range of the inverse. Express your answer as a set of numbers.arrow_forward
- T={(−7,1),(1,−1),(6,−8),(2,8)}. Find the inverse. Express your answer as a set of ordered pairs.arrow_forwardStarting with the finished version of Example 6.2, attached, change the decision criterion to "maximize expected utility," using an exponential utility function with risk tolerance $5,000,000. Display certainty equivalents on the tree. a. Keep doubling the risk tolerance until the company's best strategy is the same as with the EMV criterion—continue with development and then market if successful. The risk tolerance must reach $ 160,000,000 before the risk averse company acts the same as the EMV-maximizing company. b. With a risk tolerance of $320,000,000, the company views the optimal strategy as equivalent to receiving a sure $____________ , even though the EMV from the original strategy (with no risk tolerance) is $ 59,200.arrow_forwardComplete solutions need handwriting. For all only sure experts solve it correct complete solutionsarrow_forward
- The graph below shows the U.S. federal expenses for 2012. A) estimate the fraction of the total expenses that were spent on Medicare. Write your answer as the closest fraction whose denominator is 100. B) estimate the fraction of the total expenses that were spent on Medicare and Medicaid. Write your answer as the closest fraction, whose denominator is 100.arrow_forwardStarting with the finished version of Example 6.2, attached, change the decision criterion to "maximize expected utility," using an exponential utility function with risk tolerance $5,000,000. Display certainty equivalents on the tree. a. Keep doubling the risk tolerance until the company's best strategy is the same as with the EMV criterion—continue with development and then market if successful. The risk tolerance must reach $ ____________ before the risk averse company acts the same as the EMV-maximizing company. b. With a risk tolerance of $320,000,000, the company views the optimal strategy as equivalent to receiving a sure $____________ , even though the EMV from the original strategy (with no risk tolerance) is $ ___________ .arrow_forward2.8.1arrow_forward
- Algebra & Trigonometry with Analytic GeometryAlgebraISBN:9781133382119Author:SwokowskiPublisher:Cengage
 College Algebra (MindTap Course List)AlgebraISBN:9781305652231Author:R. David Gustafson, Jeff HughesPublisher:Cengage Learning
 College AlgebraAlgebraISBN:9781305115545Author:James Stewart, Lothar Redlin, Saleem WatsonPublisher:Cengage Learning
 Algebra: Structure And Method, Book 1AlgebraISBN:9780395977224Author:Richard G. Brown, Mary P. Dolciani, Robert H. Sorgenfrey, William L. ColePublisher:McDougal Littell


