
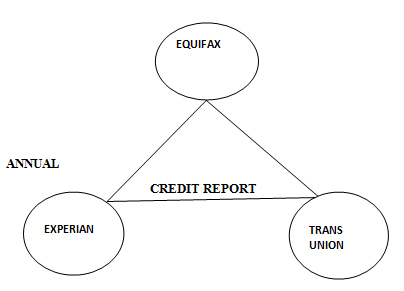
To Identify: The three credit bureaus that provides free credit reports.
Explanation of Solution
Below are the three creditsreporting agencies that provide free credit reports:
- Equifax:
They offer credit fraud protection and identify theft protection to consumers, as well as selling credit reports to businesses. In this, consumers can purchase credit monitoring services that include their Equifax credit scores.
- Experian:
Experian collects data from financial institutions that show how a customer uses financial products and compiles it into a credit history for each individual person. This information is synthesized into a credit score.
- Trans Union:
Trans Union tracks the credit history of the borrowers to produce a credit history for every individual and every financial institution and to determine whether to extend credit such as a mortgage or a credit card to customer.
Introduction:
Credit bureaus refer to a business that collects and distributes information about individuals and businesses to lenders. It is privately owned, profit making establishment that collects and compile data regarding solvency, and reputation of a particular individual in order to furnish information to subscribers.
Credit bureaus also known as credit reporting agenciesor consumer reporting agencies.
Credit bureaus provide reports that help to establish trustworthiness.
Chapter 4 Solutions
Economics Today and Tomorrow, Student Edition
Additional Business Textbook Solutions
Financial Accounting: Tools for Business Decision Making, 8th Edition
Foundations Of Finance
Essentials of Corporate Finance (Mcgraw-hill/Irwin Series in Finance, Insurance, and Real Estate)
Horngren's Financial & Managerial Accounting, The Financial Chapters (Book & Access Card)
Operations Management
Fundamentals of Management (10th Edition)

- Problem 1 Regression Discontinuity In the beginning of covid, the US government distributed covid stimulus payments. Suppose you are interested in the effect of receiving the full amount of the first stimulus payment on the total spending in dollars by single individuals in the month after receiving the payment. Single individuals with annual income below $75,00 received the full amount of the stimulus payment. You decide to use Regression Discontinuity to answer this question. The graph below shows the RD model. 3150 3100 3050 Total Spending in the month after receiving the stimulus payment 2950 3000 74000 74500 75000 75500 76000 Annual income a. What is the outcome? (5 points) b. What is the treatment? (5 points) C. What is the running variable? (5 points) d. What is the cutoff? (5 points) e. Who is in the treatment group and who is in the control group? (10 points) f. What is the discontinuity in the graph and how do you interpret it? (10 points) g. Explain a scenario which can…arrow_forwardProblem 2 Difference-in-Difference In the beginning of 2005, Minnesota increased the sales tax on alcohol. Suppose you are interested in studying the effect of the increase in sale taxes on alcohol on the number of car accidents due to drinking in Minnesota. Unlike Minnesota, Wisconsin did not change the sales tax on alcohol. You decide to use a Difference-in-difference (DID) Model. The numbers of car accidents in each state at the end of 2004 and 2005 are as follows: Year Number of car accidents in Minnesota Number of car accidents in Wisconsin 2004 2000 2500 2005 2500 3500 a. Which state is the treatment state and which state is the control state? (10 points) b. What is the change in the outcome for the treatment group between 2004 and 2005? (5 points) C. Can we interpret the change in the outcome for the treatment group between 2004 and 2005 as the causal effect of the policy on car accidents? Explain your answer. (10 points) d. What is the change in the outcome for the control…arrow_forwardEnvironmental Economicsarrow_forward
- Environmental Economicsarrow_forwardEnvironmental Economicsarrow_forward1. The current price for a barrel of oil is $28. Assume the marginal extraction cost per barrel is $8 and the interest rate is 4 percent per year. a. According to the standard Hotelling model for a nonrenewable resource, what is the forecasted price for next year? b. How would your forecast change (qualitatively) if the demand for oil increased before next year?arrow_forward
- • What are the 5 positive and 5 negative attitudes a salesperson has? What are the best way to improve those negative attitudes? • What is the another concise definition of Salesmanship? • As a Watson's salesperson in the Philippines what are they're: - earning opportunities? - chances of promotion and career growth? - rewards and awards? - incentives and fringe benefits? - employment requirements?arrow_forwardWhere in the Victoria, BC is the most logging occurring? Include relative and absolute locationsarrow_forwardIn Foresty , What do most clear cut locations have in common with each other? Do they occur along the shorelines of lakes and rivers? Near major highways? Are they near cities or far from people?arrow_forward
- How sustainable is the forestry industry in BC in your opinion? Not at all, somewhat, very and explain your reasoning.arrow_forwardIn a paragraph, no bullet, points please answer the question and follow the instructions. Give only the solution: Use the Feynman technique throughout. Assume that you’re explaining the answer to someone who doesn’t know the topic at all. 6.Draw a standard Commercial Bank Balance Sheet and briefly explain each of the main components.arrow_forwardC1 The following model can be used to study whether campaign expenditures affect election outcomes: voteA = 0 + B₁ log(expendA) + ẞ₂ log(expendB) + ẞ3 prtystrA + u, where voteA is the percentage of the vote received by Candidate A, expendA and expend are campaign expenditures by Candidates A and B, and prtystrA is a measure of party strength for Candidate A (the percentage of the most recent presidential vote that went to A's party). == (i) (ii) (iii) (iv) What is the interpretation of B₁? In terms of the parameters, state the null hypothesis that a 1% increase in A's expenditures is offset by a 1% increase in B's expenditures. Estimate the given model using the data in VOTE1.DTA and report the results in usual form. Do A's expenditures affect the outcome? What about B's expenditures? Can you use these results to test the hypothesis in part (ii)? Estimate a model that directly gives the t statistic for testing the hypothesis in part (ii). What do you conclude? (Use a two-sided…arrow_forward

 Principles of Economics (12th Edition)EconomicsISBN:9780134078779Author:Karl E. Case, Ray C. Fair, Sharon E. OsterPublisher:PEARSON
 Engineering Economy (17th Edition)EconomicsISBN:9780134870069Author:William G. Sullivan, Elin M. Wicks, C. Patrick KoellingPublisher:PEARSON
 Principles of Economics (MindTap Course List)EconomicsISBN:9781305585126Author:N. Gregory MankiwPublisher:Cengage Learning
 Managerial Economics: A Problem Solving ApproachEconomicsISBN:9781337106665Author:Luke M. Froeb, Brian T. McCann, Michael R. Ward, Mike ShorPublisher:Cengage Learning
 Managerial Economics & Business Strategy (Mcgraw-...EconomicsISBN:9781259290619Author:Michael Baye, Jeff PrincePublisher:McGraw-Hill Education