
Statistical Reasoning for Everyday Life Plus MyLab Statistics with Pearson eText -- 18 Week Access Card Package (5th Edition)
5th Edition
ISBN: 9780135990278
Author: Bennett, Jeffrey O., Briggs, William L., Triola, Mario F.
Publisher: PEARSON
expand_more
expand_more
format_list_bulleted
Concept explainers
Videos
Textbook Question
Chapter 4.3, Problem 20E
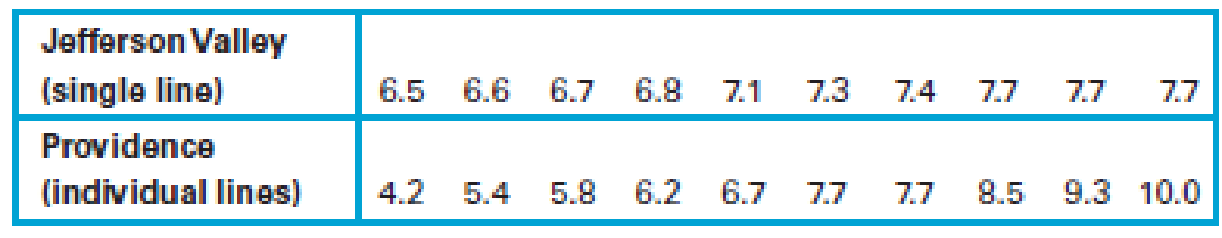
Comparing Variation. In Exercises 17–20, find the
20. Customer Waiting Times. Waiting times (in minutes) of customers at the Jefferson Valley Bank (where all customers enter a single waiting line) and the Bank of Providence (where customers wait in individual lines at three different teller windows) are listed below.
Expert Solution & Answer
Want to see the full answer?
Check out a sample textbook solution
Students have asked these similar questions
Show all work
Show all work
Show all work
Chapter 4 Solutions
Statistical Reasoning for Everyday Life Plus MyLab Statistics with Pearson eText -- 18 Week Access Card Package (5th Edition)
Ch. 4.1 - Average. Define and distinguish among mean,...Ch. 4.1 - Outliers. What are outliers? Describe the effects...Ch. 4.1 - Average Confusion. Briefly describe at least two...Ch. 4.1 - Weighting. What is a weighted mean, and when is it...Ch. 4.1 - Does It Make Sense? For Exercises 59, determine...Ch. 4.1 - Does It Make Sense? For Exercises 59, determine...Ch. 4.1 - Mode. In an analysis of salaries paid to sales...Ch. 4.1 - Employment Data. A survey asked people their...Ch. 4.1 - Mean Wage. To find the mean wage of restaurant...Ch. 4.1 - Mean, Median, and Mode. In Exercises 1016, find...
Ch. 4.1 - Mean, Median, and Mode. In Exercises 1016, find...Ch. 4.1 - Mean, Median, and Mode. In Exercises 1016, find...Ch. 4.1 - Mean, Median, and Mode. In Exercises 1016, find...Ch. 4.1 - Mean, Median, and Mode. In Exercises 1016, find...Ch. 4.1 - Mean, Median, and Mode. In Exercises 1016, find...Ch. 4.1 - Mean, Median, and Mode. In Exercises 1016, find...Ch. 4.1 - Cell Phone Radiation. Listed below are...Ch. 4.1 - Alphabetic States. The states of Alabama, Alaska,...Ch. 4.1 - Outlier Coke. The contents of cans of regular...Ch. 4.1 - Raising Your Grade. Suppose you have scores of 80,...Ch. 4.1 - Raising Your Grade. Suppose you have scores of 60,...Ch. 4.1 - Comparing Data. In Exercises 2225, find the mean...Ch. 4.1 - Comparing Data. In Exercises 2225, find the mean...Ch. 4.1 - Comparing Data. In Exercises 2225, find the mean...Ch. 4.1 - Prob. 25ECh. 4.1 - Weighted Mean. Compute the weighte means in...Ch. 4.1 - Class Grade. Ryan is taking an advanced math class...Ch. 4.1 - GPA. One common system for computing a grade point...Ch. 4.1 - Prob. 29ECh. 4.1 - Prob. 30ECh. 4.1 - 31. Stockholder Voting. A small company has six...Ch. 4.1 - Weighted Mean. In Exercises 3235, find the mean of...Ch. 4.1 - Weighted Mean. In Exercises 3235, find the mean of...Ch. 4.1 - Weighted Mean. In Exercises 3235, find the mean of...Ch. 4.1 - Weighted Mean. In Exercises 3235, find the mean of...Ch. 4.1 - U.S. Population Center. Imagine taking a huge flat...Ch. 4.2 - Modes. Distinguish between a uniform distribution...Ch. 4.2 - Prob. 2ECh. 4.2 - Prob. 3ECh. 4.2 - Prob. 4ECh. 4.2 - Prob. 5ECh. 4.2 - Does It Make Sense? For Exercises 58, determine...Ch. 4.2 - Does It Make Sense? For Exercises 58, determine...Ch. 4.2 - Does It Make Sense? For Exercises 58, determine...Ch. 4.2 - Prob. 9ECh. 4.2 - Distributions. In Exercises 912, describe the...Ch. 4.2 - Distributions. In Exercises 912, describe the...Ch. 4.2 - Distributions. In Exercises 912, describe the...Ch. 4.2 - Baseball Salaries. In a recent year, the 868...Ch. 4.2 - Boston Rainfall. The daily rainfall amounts (in...Ch. 4.2 - Describing Distributions. For each distribution...Ch. 4.2 - Describing Distributions. For each distribution...Ch. 4.2 - Describing Distributions. For each distribution...Ch. 4.2 - Describing Distributions. For each distribution...Ch. 4.2 - Describing Distributions. For each distribution...Ch. 4.2 - Describing Distributions. For each distribution...Ch. 4.2 - Describing Distributions. For each distribution...Ch. 4.2 - Describing Distributions. For each distribution...Ch. 4.2 - Describing Distributions. For each distribution...Ch. 4.2 - Describing Distributions. For each distribution...Ch. 4.2 - Describing Distributions. For each distribution...Ch. 4.2 - Describing Distributions. For each distribution...Ch. 4.3 - Variation Matters. Consider two grocery stores at...Ch. 4.3 - Variation Measures. Briefly distinguish between...Ch. 4.3 - Quartiles and Percentiles. Briefly describe how...Ch. 4.3 - Standard Deviation. Describe the process of...Ch. 4.3 - Does It Make Sense? For Exercises 58, determine...Ch. 4.3 - Does It Make Sense? For Exercises 58, determine...Ch. 4.3 - Does It Make Sense? For Exercises 58, determine...Ch. 4.3 - Does It Make Sense? For Exercises 58, determine...Ch. 4.3 - Prob. 9ECh. 4.3 - Range and Standard Deviation. Exercises 916 each...Ch. 4.3 - Range and Standard Deviation. Exercises 916 each...Ch. 4.3 - Range and Standard Deviation. Exercises 916 each...Ch. 4.3 - Range and Standard Deviation. Exercises 916 each...Ch. 4.3 - Range and Standard Deviation. Exercises 916 each...Ch. 4.3 - Range and Standard Deviation. Exercises 916 each...Ch. 4.3 - Range and Standard Deviation. Exercises 916 each...Ch. 4.3 - Prob. 17ECh. 4.3 - Comparing Variation. In Exercises 1720, find the...Ch. 4.3 - Prob. 19ECh. 4.3 - Comparing Variation. In Exercises 1720, find the...Ch. 4.3 - Calculating Percentiles. A statistics professor...Ch. 4.3 - Calculating Percentiles. A data set consists of...Ch. 4.3 - Understanding Standard Deviation. The following...Ch. 4.3 - Understanding Standard Deviation. The following...Ch. 4.3 - Comparing Data Sets. For each of Exercises 2528,...Ch. 4.3 - Comparing Data Sets. For each of Exercises 2528,...Ch. 4.3 - Comparing Data Sets. For each of Exercises 2528,...Ch. 4.3 - Comparing Data Sets. For each of Exercises 2528,...Ch. 4.3 - Manufacturing. You are in charge of a...Ch. 4.3 - Prob. 30ECh. 4.3 - Prob. 31ECh. 4.3 - Prob. 32ECh. 4.4 - False Positive and False Negative. Professional...Ch. 4.4 - Positive Test Result. A professional soccer player...Ch. 4.4 - Prob. 3ECh. 4.4 - Prob. 4ECh. 4.4 - Does It Make Sense? For Exercises 58, determine...Ch. 4.4 - Does It Make Sense? For Exercises 58, determine...Ch. 4.4 - Does It Make Sense? For Exercises 58, determine...Ch. 4.4 - Does It Make Sense? For Exercises 58, determine...Ch. 4.4 - Prob. 9ECh. 4.4 - Passing Percentages. The table below shows the...Ch. 4.4 - Test Scores. The table below shows eighth-grade...Ch. 4.4 - Test Scores. Consider the following table...Ch. 4.4 - Prob. 13ECh. 4.4 - Prob. 14ECh. 4.4 - Basketball Records. Consider the following...Ch. 4.4 - Better Drug. Two drugs, A and B, were tested on a...Ch. 4.4 - Prob. 17ECh. 4.4 - Disease Test. Suppose a test for a disease is 80%...Ch. 4.4 - Prob. 19ECh. 4.4 - Drug Trials. (This problem is based on an example...Ch. 4.4 - HIV Risks. The New York State Department of Health...Ch. 4 - Chocolate Chips. Listed below are counts of the...Ch. 4 - Prob. 2CRECh. 4 - a. What is the standard deviation for a data set...Ch. 4 - When you add the earthquake magnitudes 2.45, 3.62,...Ch. 4 - Prob. 2CQCh. 4 - Prob. 3CQCh. 4 - Prob. 4CQCh. 4 - Prob. 5CQCh. 4 - Prob. 6CQCh. 4 - A histogram is constructed for a large set of...Ch. 4 - Prob. 8CQCh. 4 - Prob. 9CQCh. 4 - Identify the names of the components that...
Knowledge Booster


Learn more about
Need a deep-dive on the concept behind this application? Look no further. Learn more about this topic, statistics and related others by exploring similar questions and additional content below.Similar questions
- A marketing agency wants to determine whether different advertising platforms generate significantly different levels of customer engagement. The agency measures the average number of daily clicks on ads for three platforms: Social Media, Search Engines, and Email Campaigns. The agency collects data on daily clicks for each platform over a 10-day period and wants to test whether there is a statistically significant difference in the mean number of daily clicks among these platforms. Conduct ANOVA test. You can provide your answer by inserting a text box and the answer must include: also please provide a step by on getting the answers in excel Null hypothesis, Alternative hypothesis, Show answer (output table/summary table), and Conclusion based on the P value.arrow_forwardA company found that the daily sales revenue of its flagship product follows a normal distribution with a mean of $4500 and a standard deviation of $450. The company defines a "high-sales day" that is, any day with sales exceeding $4800. please provide a step by step on how to get the answers Q: What percentage of days can the company expect to have "high-sales days" or sales greater than $4800? Q: What is the sales revenue threshold for the bottom 10% of days? (please note that 10% refers to the probability/area under bell curve towards the lower tail of bell curve) Provide answers in the yellow cellsarrow_forwardBusiness Discussarrow_forward
- The following data represent total ventilation measured in liters of air per minute per square meter of body area for two independent (and randomly chosen) samples. Analyze these data using the appropriate non-parametric hypothesis testarrow_forwardeach column represents before & after measurements on the same individual. Analyze with the appropriate non-parametric hypothesis test for a paired design.arrow_forwardShould you be confident in applying your regression equation to estimate the heart rate of a python at 35°C? Why or why not?arrow_forward
arrow_back_ios
SEE MORE QUESTIONS
arrow_forward_ios
Recommended textbooks for you
 Glencoe Algebra 1, Student Edition, 9780079039897...AlgebraISBN:9780079039897Author:CarterPublisher:McGraw Hill
 Big Ideas Math A Bridge To Success Algebra 1: Stu...AlgebraISBN:9781680331141Author:HOUGHTON MIFFLIN HARCOURTPublisher:Houghton Mifflin Harcourt
 Holt Mcdougal Larson Pre-algebra: Student Edition...AlgebraISBN:9780547587776Author:HOLT MCDOUGALPublisher:HOLT MCDOUGAL
 Linear Algebra: A Modern IntroductionAlgebraISBN:9781285463247Author:David PoolePublisher:Cengage Learning
Glencoe Algebra 1, Student Edition, 9780079039897...
Algebra
ISBN:9780079039897
Author:Carter
Publisher:McGraw Hill
Big Ideas Math A Bridge To Success Algebra 1: Stu...
Algebra
ISBN:9781680331141
Author:HOUGHTON MIFFLIN HARCOURT
Publisher:Houghton Mifflin Harcourt
Holt Mcdougal Larson Pre-algebra: Student Edition...
Algebra
ISBN:9780547587776
Author:HOLT MCDOUGAL
Publisher:HOLT MCDOUGAL
Linear Algebra: A Modern Introduction
Algebra
ISBN:9781285463247
Author:David Poole
Publisher:Cengage Learning
The Shape of Data: Distributions: Crash Course Statistics #7; Author: CrashCourse;https://www.youtube.com/watch?v=bPFNxD3Yg6U;License: Standard YouTube License, CC-BY
Shape, Center, and Spread - Module 20.2 (Part 1); Author: Mrmathblog;https://www.youtube.com/watch?v=COaid7O_Gag;License: Standard YouTube License, CC-BY
Shape, Center and Spread; Author: Emily Murdock;https://www.youtube.com/watch?v=_YyW0DSCzpM;License: Standard Youtube License