
a)
To draw: Graph representing when the exchange rate floats freely.
a)
Explanation of Solution
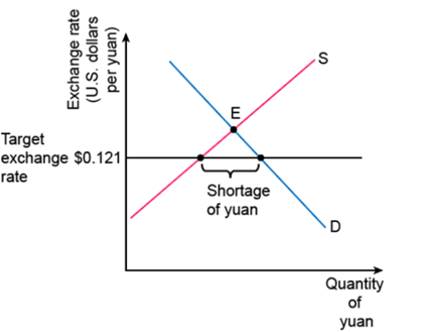
Graph 1
At the given exchange rate i.e. $0.121, the
This would occur as a result of the shortage when buyers of the Yuan would bid up its U.S. dollar price.
As the exchange rate increased, the quantity of Yuan demanded would fall while its supply would increase. If the exchange rate were allowed to increase to the eq. exchange rate, the disequilibrium would be eliminated.
Foreign Exchange rate: The rate at which currencies of two different countries are exchanged. In other words, it is the rate at which one currency is exchanged with the other currency.
b)
To draw: Graph representing exchange rate model showing restriction on foreigners to invest in C.
b)
Explanation of Solution
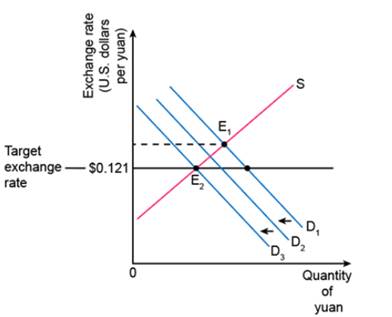
Graph 2
Placing restrictions on foreigners who want to invest in country C would reduce the demand for the Yuan, causing the demand curve to shift in the accompanying diagram from D1 to something like D2. This would cause a reduction in the shortage of the Yuan. If demand fell to D3, the disequilibrium would be completely eliminated.
Foreign Exchange rate: The rate at which currencies of two different countries are exchanged. In other words, it is the rate at which one currency is exchanged with the other currency.
c)
To draw: Graph representing exchange rate model showing removal of restriction on Chinese to invest abroad.
c)
Explanation of Solution
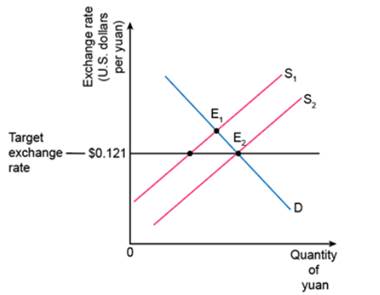
Graph 3
Removing restrictions on Chinese who wish to invest abroad would cause an increase in the supply of the Yuan and a rightward shift of the supply curve.
This increase in supply would reduce the size of the shortage.
Foreign Exchange rate: The rate at which currencies of two different countries are exchanged. In other words, it is the rate at which one currency is exchanged with the other currency.
d)
To draw: Graph representing the exchange rate model showing the imposing of taxes on C exports.
d)
Explanation of Solution
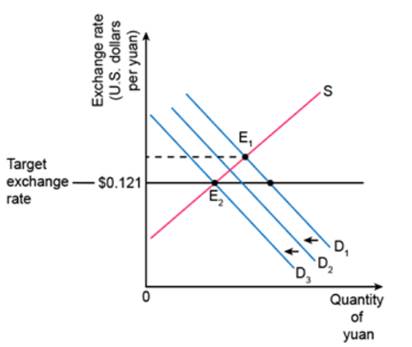
Graph 4
Increasing taxes on exports would increase the prices resulting in a decrease in the demand for Yuan with which to purchase those goods. The graphical analysis here is virtually identical to that found in the figure accompanying part b. (Demand keeps decreasing until it hits the target)
Foreign Exchange rate: The rate at which currencies of two different countries are exchanged. In other words, it is the rate at which one currency is exchanged with the other currency.
Want to see more full solutions like this?
Chapter 43 Solutions
Krugman's Economics For The Ap® Course

- Imagine you are a world leader and you just viewed this presentation as part of the United Nations Sustainable Development Goal Meeting. Summarize your findings https://www.youtube.com/watch?v=v7WUpgPZzpIarrow_forwardPlease draw a standard Commercial Bank Balance Sheet and briefly explain each of the main components.arrow_forwardPlease draw the Federal Reserve System’s Balance Sheet and briefly explain each of the main components.arrow_forward
- 19. In a paragraph, no bullet, points please answer the question and follow the instructions. Give only the solution: Use the Feynman technique throughout. Assume that you’re explaining the answer to someone who doesn’t know the topic at all. How does the Federal Reserve currently get the federal funds rate where they want it to be?arrow_forward18. In a paragraph, no bullet, points please answer the question and follow the instructions. Give only the solution: Use the Feynman technique throughout. Assume that you’re explaining the answer to someone who doesn’t know the topic at all. Carefully compare and contrast fiscal policy and monetary policy.arrow_forward15. In a paragraph, no bullet, points please answer the question and follow the instructions. Give only the solution: Use the Feynman technique throughout. Assume that you’re explaining the answer to someone who doesn’t know the topic at all. What are the common arguments for and against high levels of federal debt?arrow_forward
- 17. In a paragraph, no bullet, points please answer the question and follow the instructions. Give only the solution: Use the Feynman technique throughout. Assume that you’re explaining the answer to someone who doesn’t know the topic at all. Explain the difference between present value and future value. Be sure to use and explain the mathematical formulas for both. How does one interpret these formulas?arrow_forward12. Give the solution: Use the Feynman technique throughout. Assume that you’re explaining the answer to someone who doesn’t know the topic at all. Show and carefully explain the Taylor rule and all of its components, used as a monetary policy guide.arrow_forward20. In a paragraph, no bullet, points please answer the question and follow the instructions. Give only the solution: Use the Feynman technique throughout. Assume that you’re explaining the answer to someone who doesn’t know the topic at all. What is meant by the Federal Reserve’s new term “ample reserves”? What may be hidden in this new formulation by the Fed?arrow_forward
- 14. In a paragraph, no bullet, points please answer the question and follow the instructions. Give only the solution: Use the Feynman technique throughout. Assume that you’re explaining the answer to someone who doesn’t know the topic at all. What is the Keynesian view of fiscal policy and why are some economists skeptical?arrow_forward16. In a paragraph, no bullet, points please answer the question and follow the instructions. Give only the solution: Use the Feynman technique throughout. Assume that you’re explaining the answer to someone who doesn’t know the topic at all. Describe a bond or Treasury security. What are its components and what do they mean?arrow_forward13. In a paragraph, no bullet, points please answer the question and follow the instructions. Give only the solution: Use the Feynman technique throughout. Assume that you’re explaining the answer to someone who doesn’t know the topic at all. Where does the government get its funds that it spends? What is the difference between federal debt and federal deficit?arrow_forward

 Principles of Economics (12th Edition)EconomicsISBN:9780134078779Author:Karl E. Case, Ray C. Fair, Sharon E. OsterPublisher:PEARSON
 Engineering Economy (17th Edition)EconomicsISBN:9780134870069Author:William G. Sullivan, Elin M. Wicks, C. Patrick KoellingPublisher:PEARSON
 Principles of Economics (MindTap Course List)EconomicsISBN:9781305585126Author:N. Gregory MankiwPublisher:Cengage Learning
 Managerial Economics: A Problem Solving ApproachEconomicsISBN:9781337106665Author:Luke M. Froeb, Brian T. McCann, Michael R. Ward, Mike ShorPublisher:Cengage Learning
 Managerial Economics & Business Strategy (Mcgraw-...EconomicsISBN:9781259290619Author:Michael Baye, Jeff PrincePublisher:McGraw-Hill Education