EBK UNDERSTANDING BASIC STATISTICS
7th Edition
ISBN: 8220100547560
Author: BRASE
Publisher: CENGAGE L
expand_more
expand_more
format_list_bulleted
Concept explainers
Videos
Textbook Question
Chapter 4.2, Problem 4P
Critical Thinking If two variables have a
Expert Solution & Answer

Trending nowThis is a popular solution!

Students have asked these similar questions
https://www.hawkeslearning.com/Statistics/dbs2/datasets.html
NC Current Students - North Ce X | NC Canvas Login Links - North ( X
Final Exam Comprehensive x Cengage Learning
x
WASTAT - Final Exam - STAT
→
C
webassign.net/web/Student/Assignment-Responses/submit?dep=36055360&tags=autosave#question3659890_9
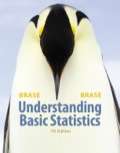
Part (b)
Draw a scatter plot of the ordered pairs.
N
Life
Expectancy
Life
Expectancy
80
70
600
50
40
30
20
10
Year of
1950
1970 1990
2010 Birth
O
Life
Expectancy
Part (c)
800
70
60
50
40
30
20
10
1950
1970 1990
W
ALT
林
$
#
4
R
J7
Year of
2010 Birth
F6
4+
80
70
60
50
40
30
20
10
Year of
1950 1970 1990
2010 Birth
Life
Expectancy
Ox
800
70
60
50
40
30
20
10
Year of
1950 1970 1990 2010 Birth
hp
P.B.
KA
&
7
80
% 5
H
A
B
F10
711
N
M
K
744
PRT SC
ALT
CTRL
Harvard University
California Institute of Technology
Massachusetts Institute of Technology
Stanford University
Princeton University
University of Cambridge
University of Oxford
University of California, Berkeley
Imperial College London
Yale University
University of California, Los Angeles
University of Chicago
Johns Hopkins University
Cornell University
ETH Zurich
University of Michigan
University of Toronto
Columbia University
University of Pennsylvania
Carnegie Mellon University
University of Hong Kong
University College London
University of Washington
Duke University
Northwestern University
University of Tokyo
Georgia Institute of Technology
Pohang University of Science and Technology
University of California, Santa Barbara
University of British Columbia
University of North Carolina at Chapel Hill
University of California, San Diego
University of Illinois at Urbana-Champaign
National University of Singapore
McGill…
Chapter 4 Solutions
EBK UNDERSTANDING BASIC STATISTICS
Ch. 4.1 - Note: Answers may vary due to rounding....Ch. 4.1 - Note: Answers may vary due to rounding....Ch. 4.1 - Note: Answers may vary due to rounding....Ch. 4.1 - Note: Answers may vary due to rounding....Ch. 4.1 - Critical Thinking: Linear Correlation Look at the...Ch. 4.1 - Critical Thinking: Linear Correlation Look at the...Ch. 4.1 - Critical Thinking: Lurking Variables Over the past...Ch. 4.1 - Critical Thinking: Lurking Variables Over the past...Ch. 4.1 - Critical Thinking: Lurking Variables Over the past...Ch. 4.1 - Critical Thinking: Lurking Variables Over the past...
Ch. 4.1 - Interpretation Trevor conducted a study and found...Ch. 4.1 - Interpretation Do people who spend more time on...Ch. 4.1 - Veterinary Science: Shetland Ponies How much...Ch. 4.1 - Health Insurance:Administrative Cost The following...Ch. 4.1 - Meteorology: Cyclones Can a low barometer reading...Ch. 4.1 - Geology: Earthquakes Is the magnitude of an...Ch. 4.1 - Baseball: Batting Averages and Home Runs In...Ch. 4.1 - University Crime: FBI Report Do larger...Ch. 4.1 - Prob. 19PCh. 4.1 - Prob. 20PCh. 4.1 - Expand Your Knowledge: Using a Table to Test The...Ch. 4.1 - Expand Your Knowledge: Sample Size and...Ch. 4.1 - Prob. 23PCh. 4.2 - Statistical Literacy In the least-squares line...Ch. 4.2 - Statistical Literacy In the least squares line...Ch. 4.2 - Critical Thinking When we use a least-squares line...Ch. 4.2 - Critical Thinking If two variables have a negative...Ch. 4.2 - Critical Thinking: Interpreting Computer Printouts...Ch. 4.2 - Critical Thinking: Interpreting Computer Printouts...Ch. 4.2 - Economics: Entry-Level Jobs An economist is...Ch. 4.2 - Ranching: Cattle You are the foreman of the Bar-S...Ch. 4.2 - Weight of Car: Miles per Gallon Do heavier cars...Ch. 4.2 - Basketball: Fouls Data for this problem are based...Ch. 4.2 - Auto Accidents: Age Data for this problem are...Ch. 4.2 - Auto Accidents: Age Let x be the age of a licensed...Ch. 4.2 - Incoine: Medicai Care Let x be per capita income...Ch. 4.2 - Violent Crimes: Prisons Does prison really deter...Ch. 4.2 - Education: Violent Crime The following data are...Ch. 4.2 - Research: Patents The following data are based on...Ch. 4.2 - Archaeology: Artifacts Data for this problem are...Ch. 4.2 - Cricket Chirps: Temperature Anyone who has been...Ch. 4.2 - Expand Your Knowledge: Residual Plot The...Ch. 4.2 - Residual Plot: Miles per Gallon Consider the data...Ch. 4.2 - Expand Your knowledge: Logarithmic...Ch. 4.2 - Expand Your Knowledge: Logarithmic...Ch. 4.2 - Prob. 24PCh. 4.2 - Expand Your Knowledge: Logarithmic...Ch. 4 - Statistical Literacy Suppose the scatter diagram...Ch. 4 - Critical Thinking Suppose you and a friend each...Ch. 4 - Statistical Literacy When using the least-squares...Ch. 4 - StatisticalLiteracy Suppose that for x = 3. the...Ch. 4 - In Problems 9-14, (a) Draw a scatter diagram for...Ch. 4 - In Problems 9-14, (a) Draw a scatter diagram for...Ch. 4 - In Problems 9-14, (a) Draw a scatter diagram for...Ch. 4 - In Problems 9-14, (a) Draw a scatter diagram for...Ch. 4 - In Problems 9-14, (a) Draw a scatter diagram for...Ch. 4 - In Problems 9-14, (a) Draw a scatter diagram for...Ch. 4 - Prob. 1UTACh. 4 - Prob. 2UTACh. 4 - Prob. 3UTACh. 4 - Prob. 4UTACh. 4 - The data in this section are taken from this...Ch. 4 - The data in this section are taken from this...
Knowledge Booster


Learn more about
Need a deep-dive on the concept behind this application? Look no further. Learn more about this topic, statistics and related others by exploring similar questions and additional content below.Similar questions
- Name Harvard University California Institute of Technology Massachusetts Institute of Technology Stanford University Princeton University University of Cambridge University of Oxford University of California, Berkeley Imperial College London Yale University University of California, Los Angeles University of Chicago Johns Hopkins University Cornell University ETH Zurich University of Michigan University of Toronto Columbia University University of Pennsylvania Carnegie Mellon University University of Hong Kong University College London University of Washington Duke University Northwestern University University of Tokyo Georgia Institute of Technology Pohang University of Science and Technology University of California, Santa Barbara University of British Columbia University of North Carolina at Chapel Hill University of California, San Diego University of Illinois at Urbana-Champaign National University of Singapore…arrow_forwardA company found that the daily sales revenue of its flagship product follows a normal distribution with a mean of $4500 and a standard deviation of $450. The company defines a "high-sales day" that is, any day with sales exceeding $4800. please provide a step by step on how to get the answers in excel Q: What percentage of days can the company expect to have "high-sales days" or sales greater than $4800? Q: What is the sales revenue threshold for the bottom 10% of days? (please note that 10% refers to the probability/area under bell curve towards the lower tail of bell curve) Provide answers in the yellow cellsarrow_forwardFind the critical value for a left-tailed test using the F distribution with a 0.025, degrees of freedom in the numerator=12, and degrees of freedom in the denominator = 50. A portion of the table of critical values of the F-distribution is provided. Click the icon to view the partial table of critical values of the F-distribution. What is the critical value? (Round to two decimal places as needed.)arrow_forward
- A retail store manager claims that the average daily sales of the store are $1,500. You aim to test whether the actual average daily sales differ significantly from this claimed value. You can provide your answer by inserting a text box and the answer must include: Null hypothesis, Alternative hypothesis, Show answer (output table/summary table), and Conclusion based on the P value. Showing the calculation is a must. If calculation is missing,so please provide a step by step on the answers Numerical answers in the yellow cellsarrow_forwardShow all workarrow_forwardShow all workarrow_forward
arrow_back_ios
SEE MORE QUESTIONS
arrow_forward_ios
Recommended textbooks for you
 Glencoe Algebra 1, Student Edition, 9780079039897...AlgebraISBN:9780079039897Author:CarterPublisher:McGraw Hill
 Big Ideas Math A Bridge To Success Algebra 1: Stu...AlgebraISBN:9781680331141Author:HOUGHTON MIFFLIN HARCOURTPublisher:Houghton Mifflin Harcourt

 College AlgebraAlgebraISBN:9781305115545Author:James Stewart, Lothar Redlin, Saleem WatsonPublisher:Cengage Learning
 Elementary Linear Algebra (MindTap Course List)AlgebraISBN:9781305658004Author:Ron LarsonPublisher:Cengage Learning
Glencoe Algebra 1, Student Edition, 9780079039897...
Algebra
ISBN:9780079039897
Author:Carter
Publisher:McGraw Hill
Big Ideas Math A Bridge To Success Algebra 1: Stu...
Algebra
ISBN:9781680331141
Author:HOUGHTON MIFFLIN HARCOURT
Publisher:Houghton Mifflin Harcourt
College Algebra
Algebra
ISBN:9781305115545
Author:James Stewart, Lothar Redlin, Saleem Watson
Publisher:Cengage Learning
Elementary Linear Algebra (MindTap Course List)
Algebra
ISBN:9781305658004
Author:Ron Larson
Publisher:Cengage Learning
Correlation Vs Regression: Difference Between them with definition & Comparison Chart; Author: Key Differences;https://www.youtube.com/watch?v=Ou2QGSJVd0U;License: Standard YouTube License, CC-BY
Correlation and Regression: Concepts with Illustrative examples; Author: LEARN & APPLY : Lean and Six Sigma;https://www.youtube.com/watch?v=xTpHD5WLuoA;License: Standard YouTube License, CC-BY