Numerical Analysis, Books A La Carte Edition (3rd Edition)
3rd Edition
ISBN: 9780134697338
Author: Timothy Sauer
Publisher: PEARSON
expand_more
expand_more
format_list_bulleted
Concept explainers
Videos
Textbook Question
Chapter 4.2, Problem 3E
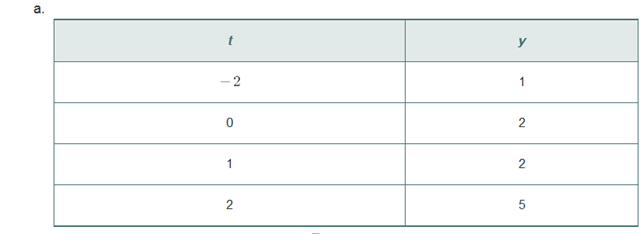
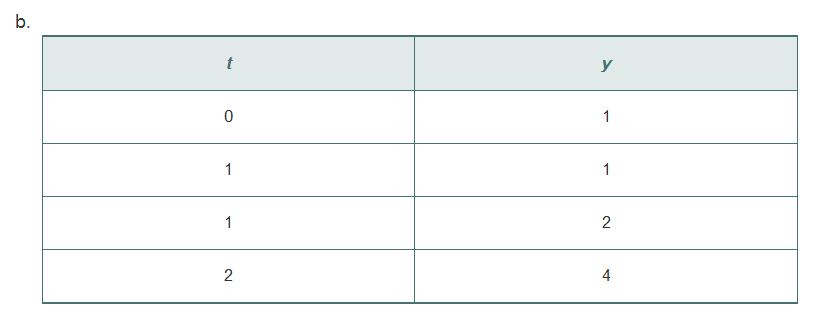
Fit data to the exponential model by using linearization. Find the 2-norm of the difference between the data points
Expert Solution & Answer
Want to see the full answer?
Check out a sample textbook solution
Students have asked these similar questions
25.5. Find the Laurent series for the function 1/[(z - 1)(-2)(z - 3)]
in the following domains: (a). 0 3.
شهری
25.1. Expand each of the following functions f(z) in a Laurent series
on the indicated domain:
(a).
z² - 2z+5
(2-2)(z² + 1)'
(c). Log
za
2 b
(z -
موجود
11, 29,
where b>a> 1 are real, |z| > b.
25.3. Find the Laurent series for the function z/[(22 + 1)(z² + 4)] in
the following domains (a). 02.
Chapter 4 Solutions
Numerical Analysis, Books A La Carte Edition (3rd Edition)
Ch. 4.1 - Solve the normal equations to find the least...Ch. 4.1 - Find the least squares solutions and RMSE of the...Ch. 4.1 - Find the least squares solution of the...Ch. 4.1 - Let mn, let A be the mn identity matrix (the...Ch. 4.1 - Prove that the 2-norm is a vector norm. You...Ch. 4.1 - Let A be an nn nonsingular matrix. (a) Prove that...Ch. 4.1 - Find the best line through the set of data points,...Ch. 4.1 - Find the best line through the set of data points,...Ch. 4.1 - Find the best parabola through each data point set...Ch. 4.1 - Find the best degree 3 polynomial through each set...
Ch. 4.1 - Assume that the height of a model rocket is...Ch. 4.1 - Given data points...Ch. 4.1 - Form the normal equations, and compute the least...Ch. 4.1 - Prob. 2CPCh. 4.1 - Prob. 3CPCh. 4.1 - Prob. 4CPCh. 4.1 - 5. A company test-markets a new soft drink in 22...Ch. 4.1 - What is the slope of the parabola y=x2on[ 0,1 ] ?...Ch. 4.1 - Find the least squares (a) line (b) parabola...Ch. 4.1 - Let A be the 10n matrix formed by the first n...Ch. 4.1 - Prob. 9CPCh. 4.1 - The following data, collected by U.S. Bureau of...Ch. 4.2 - Fit data to the periodic model...Ch. 4.2 - Fit the data to the periodic models...Ch. 4.2 - Fit data to the exponential model by using...Ch. 4.2 - Prob. 4ECh. 4.2 - Fit data to the power law model by using...Ch. 4.2 - Prob. 6ECh. 4.2 - Fit the monthly data for Japan 2003 oil...Ch. 4.2 - Prob. 2CPCh. 4.2 - Prob. 3CPCh. 4.2 - Prob. 4CPCh. 4.2 - Prob. 5CPCh. 4.2 - Prob. 6CPCh. 4.2 - Prob. 7CPCh. 4.2 - The file scrippsy. txt, available from the...Ch. 4.2 - The file scrippsm.txt, available from the textbook...Ch. 4.3 - Apply classical Gram-Schmidt orthogonalization to...Ch. 4.3 - Apply classical Gram-Schmidt orthogonalization to...Ch. 4.3 - Apply modified Gram--Schmidt orthogonalization to...Ch. 4.3 - Apply modified Gram-Schmidt orthogonalization to...Ch. 4.3 - Prob. 5ECh. 4.3 - Prob. 6ECh. 4.3 - Prob. 7ECh. 4.3 - Find the QR factorization and use it to solve the...Ch. 4.3 - Prove that a square matrix is orthogonal if and...Ch. 4.3 - Prove that the product of two orthogonal mm...Ch. 4.3 - Show that the Gram-Schmidt orthogonalization of an...Ch. 4.3 - Show that the Householder reflector method for the...Ch. 4.3 - Let P be the matrix defined in (4.29). Show (a)...Ch. 4.3 - Prob. 14ECh. 4.3 - Prob. 15ECh. 4.3 - Write a MATLAB program that implements the...Ch. 4.3 - Apply the classical Gram-Schmidt, modified...Ch. 4.3 - Prob. 3CPCh. 4.3 - Write a MATLAB program that implements (a)...Ch. 4.3 - Prob. 5CPCh. 4.3 - Use the MATLAB QR factorization to find the least...Ch. 4.3 - Prob. 7CPCh. 4.3 - Let x1,...,x11be11 be evenly spaced points in...Ch. 4.4 - Solve Ax=b for the following A and b=[ 1,0,0 ]T,...Ch. 4.4 - Prob. 2ECh. 4.4 - Let A=[ 10a1301a23001 ]. Prove that for any x0 and...Ch. 4.4 - Prob. 4ECh. 4.4 - Prob. 1CPCh. 4.4 - Prob. 2CPCh. 4.4 - Prob. 3CPCh. 4.4 - Let A be the matrix from Computer Problem 3, but...Ch. 4.4 - Prob. 5CPCh. 4.5 - The Gauss-Newton Method can be applied to find the...Ch. 4.5 - Prob. 2ECh. 4.5 - Prove that the distance from a point (x,y) to a...Ch. 4.5 - Prob. 4ECh. 4.5 - Find the matrix Dr needed for the application of...Ch. 4.5 - Prob. 6ECh. 4.5 - Prob. 7ECh. 4.5 - Prob. 1CPCh. 4.5 - Prob. 2CPCh. 4.5 - Prob. 3CPCh. 4.5 - Prob. 4CPCh. 4.5 - Prob. 5CPCh. 4.5 - Prob. 6CPCh. 4.5 - Prob. 7CPCh. 4.5 - Prob. 8CPCh. 4.5 - Prob. 9CPCh. 4.5 - Prob. 10CPCh. 4.5 - Prob. 11CPCh. 4.5 - Prob. 1SACh. 4.5 - Prob. 2SACh. 4.5 - Prob. 3SACh. 4.5 - Prob. 4SACh. 4.5 - Now repeat Step 4 with a more tightly grouped set...Ch. 4.5 - Decide whether the GPS en-or and condition number...
Knowledge Booster


Learn more about
Need a deep-dive on the concept behind this application? Look no further. Learn more about this topic, subject and related others by exploring similar questions and additional content below.Similar questions
- 25.2. Find the Laurent series for the function 1/[z(z-1)] in the follow- ing domains: (a). 0<|z|< 1, (b). 1 <|z|, (c). 0<|z1|< 1, (d). 1< |z1|, (e). 1<|z2|<2.arrow_forward25.1. Expand each of the following functions f(z) in a Laurent series on the indicated domain: 22-2z+5 (z - 2) (z² + 1)' (z 11, 22 (a). (c). Log (2-8) where b>a> 1 are real, |z|> b. barrow_forward25.5. Find the Laurent series for the function 1/[(2-1)(z-2)(z-3)] in the following domains: (a). 0 3.arrow_forward
- Can you explain how the error term in the CF Algorithm relates to the (m+1)th complete quotient? Also, what would be a good way to explain the connection between these two slides? How can one transition between them for a presentation?arrow_forwardHow can I explain the pi example in a presentation? I'm having trouble transitioning between these two slidesarrow_forwardMcGilla Golf has decided to sell a new line of golf clubs. The clubs will sell for $895 per set and have a variable cost of $431 per set. The company has spent $200,000 for a marketing study that determined the company will sell 80,000 sets per year for seven years. The marketing study also determined that the company will lose sales of 8,600 sets per year of its high-priced clubs. The high-priced clubs sell at $1,325 and have variable costs of $645. The company will also increase sales of its cheap clubs by 10,800 sets per year. The cheap clubs sell for $340 and have variable costs of $141 per set. The fixed costs each year will be $14,350,000. The company has also spent $1,500,000 on research and development for the new clubs. The plant and equipment required will cost $43,700,000 and will be depreciated on a straight-line basis. The new clubs will also require an increase in net working capital of $3,625,000 that will be returned at the end of the project. The tax rate is 25…arrow_forward
- You have been hired as an intern to run analyses on the data and report the results back to Sarah; the five questions that Sarah needs you to address are given below. Does there appear to be a positive or negative relationship between price and screen size? Use a scatter plot to examine the relationship. Determine and interpret the correlation coefficient between the two variables. In your interpretation, discuss the direction of the relationship (positive, negative, or zero relationship). Also discuss the strength of the relationship. Estimate the relationship between screen size and price using a simple linear regression model and interpret the estimated coefficients. (In your interpretation, tell the dollar amount by which price will change for each unit of increase in screen size). Include the manufacturer dummy variable (Samsung=1, 0 otherwise) and estimate the relationship between screen size, price and manufacturer dummy as a multiple linear regression model. Interpret the…arrow_forwardDoes there appear to be a positive or negative relationship between price and screen size? Use a scatter plot to examine the relationship. How to take snapshots: if you use a MacBook, press Command+ Shift+4 to take snapshots. If you are using Windows, use the Snipping Tool to take snapshots. Question 1: Determine and interpret the correlation coefficient between the two variables. In your interpretation, discuss the direction of the relationship (positive, negative, or zero relationship). Also discuss the strength of the relationship. Value of correlation coefficient: Direction of the relationship (positive, negative, or zero relationship): Strength of the relationship (strong/moderate/weak): Question 2: Estimate the relationship between screen size and price using a simple linear regression model and interpret the estimated coefficients. In your interpretation, tell the dollar amount by which price will change for each unit of increase in screen size. (The answer for the…arrow_forwardTri-County Utilities, Inc., supplies natural gas to customers in a three-county area. The company purchases natural gas from two companies: Southern Gas and Northwest Gas. Demand forecasts for the coming winter season are as follows: Hamilton County, 400 units; Butler County, 200 units; and Clermont County, 300 units. Contracts to provide the following quantities have been written: Southern Gas, 500 units; and Northwest Gas, 400 units. Distribution costs for the counties vary, depending upon the location of the suppliers. The distribution costs per unit (in thousands of dollars) are as follows. From To Hamilton Butler Clermont Southern Gas 10 20 15 Northwest Gas 12 15 18 (a) Develop a network representation of this problem. (Submit a file with a maximum size of 1 MB.) Choose File No file chosen Assignment 3 graph.docx Score: 1 out of 1 Comment: (b) Develop a linear programming model that can be used to determine the plan that will minimize total distribution costs (in thousands of…arrow_forward
- Use the method of undetermined coefficients to solve the given nonhomogeneous system. dx dt = 2x + 3y − 8 dy dt = −x − 2y + 6 X(t) =arrow_forwardAs discussed in Section 8.3, the Markowitz model uses the variance of the portfolio as the measure of risk. However, variance includes deviations both below and above the mean return. Semivariance includes only deviations below the mean and is considered by many to be a better measure of risk. (a) Develop a model that minimizes semivariance for the Hauck Financial data given in the file HauckData with a required return of 10%. Assume that the five planning scenarios in the Hauck Financial Services model are equally likely to occur. Hint: Modify model (8.10)–(8.19). Define a variable ds for each scenario and let ds ≥ R − Rs with ds ≥ 0. Then make the objective function: Min 1 5 5 s = 1 ds2. Let FS = proportion of portfolio invested in the foreign stock mutual fund IB = proportion of portfolio invested in the intermediate-term bond fund LG = proportion of portfolio invested in the large-cap growth fund LV = proportion of portfolio invested in the large-cap value fund…arrow_forwardCalculus lll May I please have the blank lines completed, and final statement defined as a result? Thank you for the support!arrow_forward
arrow_back_ios
SEE MORE QUESTIONS
arrow_forward_ios
Recommended textbooks for you
 Algebra & Trigonometry with Analytic GeometryAlgebraISBN:9781133382119Author:SwokowskiPublisher:Cengage
 Elementary Linear Algebra (MindTap Course List)AlgebraISBN:9781305658004Author:Ron LarsonPublisher:Cengage Learning
 Algebra and Trigonometry (MindTap Course List)AlgebraISBN:9781305071742Author:James Stewart, Lothar Redlin, Saleem WatsonPublisher:Cengage Learning
 Glencoe Algebra 1, Student Edition, 9780079039897...AlgebraISBN:9780079039897Author:CarterPublisher:McGraw Hill
Algebra & Trigonometry with Analytic Geometry
Algebra
ISBN:9781133382119
Author:Swokowski
Publisher:Cengage
Elementary Linear Algebra (MindTap Course List)
Algebra
ISBN:9781305658004
Author:Ron Larson
Publisher:Cengage Learning
Algebra and Trigonometry (MindTap Course List)
Algebra
ISBN:9781305071742
Author:James Stewart, Lothar Redlin, Saleem Watson
Publisher:Cengage Learning
Glencoe Algebra 1, Student Edition, 9780079039897...
Algebra
ISBN:9780079039897
Author:Carter
Publisher:McGraw Hill
Correlation Vs Regression: Difference Between them with definition & Comparison Chart; Author: Key Differences;https://www.youtube.com/watch?v=Ou2QGSJVd0U;License: Standard YouTube License, CC-BY
Correlation and Regression: Concepts with Illustrative examples; Author: LEARN & APPLY : Lean and Six Sigma;https://www.youtube.com/watch?v=xTpHD5WLuoA;License: Standard YouTube License, CC-BY