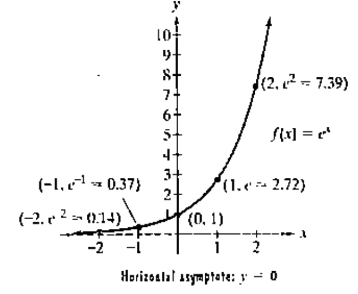
Problem 1CVC: Fill in each blank so that the resulting statement is true. The exponential function f with base b... Problem 2CVC: The graph of the exponential function f with base b approaches, but does not touch, the ________... Problem 3CVC: 3. The value that approaches as n gets larger and larger is the irrational number ________, called... Problem 4CVC: Consider the compound interest formula A=P(1+rn)nt. This formula gives the balance,________ in an... Problem 5CVC: 5. If compound interest is paid twice a year, we say that the interest is compounded... Problem 1E: In Exercises 110, approximate each number using a calculator. Round your answer to three decimal... Problem 2E: In Exercises 1-10, approximate each number using a calculator. Round your answer to three decimal... Problem 3E: In Exercises 1-10, approximate each number using a calculator. Round your answer to three decimal... Problem 4E: In Exercises 1-10, approximate each number using a calculator. Round your answer to three decimal... Problem 5E: In Exercises 1-10, approximate each number using a calculator. Round your answer to three decimal... Problem 6E: In Exercises 1-10, approximate each number using a calculator. Round your answer to three decimal... Problem 7E: In Exercises 1-10, approximate each number using a calculator. Round your answer to three decimal... Problem 8E: In Exercises 1-10, approximate each number using a calculator. Round your answer to three decimal... Problem 9E: In Exercises 1-10, approximate each number using a calculator. Round your answer to three decimal... Problem 10E: In Exercises 1-10, approximate each number using a calculator. Round your answer to three decimal... Problem 11E: In Exercises 11-I8, graph each function by making a table of coordinates. If applicable, use a... Problem 12E: In Exercises 11-18, graph each function by making a table of coordinates. If applicable, use a... Problem 13E: In Exercises 11-18, graph each function by making a table of coordinates. If applicable, use a... Problem 14E: In Exercises 11-18, graph each function by making a table of coordinates. If applicable, use a... Problem 15E: In Exercises 11-18, graph each function by making a table of coordinates If applicable, use a... Problem 16E: In Exercises 11-18, graph each function by making a table of coordinates. If applicable, use a... Problem 17E: In Exercises 11-18, graph each function by making a table of coordinates, If applicable, use a... Problem 18E: In Exercises 11-18,graph each function by making a table of coordinates. If applicable, use a... Problem 19E: In Exercises 19-24, the graph of an exponential function is given. Select the function for each... Problem 20E: In Exercises 19-24, the graph of an exponential function is given Select the function for each graph... Problem 21E: In Exercises 19-24, the graph of an exponential function is given Select the function for each graph... Problem 22E: In Exercises 19-24, the graph of an exponential function is given. Select the function for each... Problem 23E: In Exercises 19-24, the graph of an exponential function is given. Select the function for each... Problem 24E: In Exercises 19-24, the graph of an exponential function is given. Select the function for each... Problem 25E: In Exercises 25-34, begin by graphing f(x)=2x . Then use transformations of this graph to graph the... Problem 26E: In Exercises 25-34, begin by graphing . Then use transformations of this graph to graph the given... Problem 27E: In Exercises 25-34, begin by graphing . Then use transformations of this graph to graph the given... Problem 28E: In Exercises 25-34, begin by graphing f(x)=2x . Then use transformations of this graph to graph the... Problem 29E: In Exercises 25-34, begin by graphing f(x)=2x . Then use transformations of this graph to graph the... Problem 30E: In Exercises 25-34, begin by graphing . Then use transformations of this graph to graph the given... Problem 31E: In Exercises 25-34, begin by graphing f(x)=2x . Then use transformations of this graph to graph the... Problem 32E: In Exercises 25-34, begin by graphing . Then use transformations of this graph to graph the given... Problem 33E Problem 34E: In Exercises 25-34, begin by graphing f(x)=2x. Then use transformations of this graph to graph the... Problem 35E: The figure shows the graph of . In Exercises 35-16, use transformations of this graph to graph each... Problem 36E: The figure shows the graph of . In Exercises 35—16, use transformations of this graph to graph each... Problem 37E: The figure shows the graph of f(x)=c4 . In Exercises 3516, use transformations of this graph to... Problem 38E: The figure shows the graph of f(x)=c4 . In Exercises 3516, use transformations of this graph to... Problem 39E: The figure shows the graph of . In Exercises 35—16, use transformations of this graph to graph each... Problem 40E: The figure shows the graph of . In Exercises 35—16, use transformations of this graph to graph each... Problem 41E: The figure shows the graph of . In Exercises 35—16, use transformations of this graph to graph each... Problem 42E: The figure shows the graph of . In Exercises 35—16, use transformations of this graph to graph each... Problem 43E: The figure shows the graph of f(x)=c4 . In Exercises 3516, use transformations of this graph to... Problem 44E: The figure shows the graph of . In Exercises 35—16, use transformations of this graph to graph each... Problem 45E: The figure shows the graph of . In Exercises 35—16, use transformations of this graph to graph each... Problem 46E: The figure shows the graph of f(x)=c4 . In Exercises 3516, use transformations of this graph to... Problem 47E Problem 48E Problem 49E: In Exercises 47-52, graph functions f and g in the same rectangular coordinate system. Graph and... Problem 50E Problem 51E Problem 52E Problem 53E: Use the compound interest formulas A=P(1+rn)nt and A=Pen to solve Exercises 53-56, Round answers to... Problem 54E Problem 55E: Use the compound interest formulas A=P(1+rn)nt and A=Pen to solve Exercises 53-5, Round answers to... Problem 56E Problem 57E Problem 58E Problem 59E Problem 60E Problem 61E: In Exercises 61-64, give the equation of each exponential function whose graph is shown.
61.
Problem 62E: In Exercises 61-64, give the equation of each exponential function whose graph is shown. Problem 63E: In Exercises 61-64, give the equation of each exponential function whose graph is shown.
63.
Problem 64E: In Exercises 61-64, give the equation of each exponential function whose graph is shown.
64.
Problem 65E: Use a calculator with a key or a key to solve Exercises 65-70.
65. India is currently one of the... Problem 66E Problem 67E Problem 68E Problem 69E Problem 70E: Use a calculator with a key or a key to solve Exercises 65-70.
70. A decimal approximation for is... Problem 71E Problem 72E Problem 73E Problem 74E Problem 75E Problem 76E: What is an exponential function? Problem 77E: What is the natural exponential function? Problem 78E Problem 79E Problem 80E: 80. Describe how you could use the graph of to obtain a decimal approximation for .
Problem 81E: 81. You have $10,000 to invest. One bank pays 5% interest compounded quarterly and a second bank... Problem 82E: a. Graph y=er and y=1+x+x22 rectangle. b. Graph y=er and y=1+x+x22+x36 in the same viewing... Problem 83E Problem 84E Problem 85E Problem 86E Problem 87E Problem 88E Problem 89E: In Exercises 87-90, determine whether each statement is true or false. If the statement is false,... Problem 90E: In Exercises 87-90, determine whether each statement is true or false. If the statement is false,... Problem 91E: 91. The graphs labeled (a)-(d) in the figure represent and . but not necessarily in that order.... Problem 92E Problem 93E Problem 94E Problem 95E Problem 96E: Solve and graph the solution set on a number line: 2x2+5x12 (Section 3.6, Example 1) Problem 97E: Exercises 97-99 will help you prepare for the material covered in the next section.
97. What problem... Problem 98E Problem 99E: Exercises 97-99 will help you prepare for the material covered in the next section. Solve: (x3)20 format_list_bulleted


 Algebra & Trigonometry with Analytic GeometryAlgebraISBN:9781133382119Author:SwokowskiPublisher:Cengage