
ELEMENTARY STATISTICS W/MYMATHLAB<CUSTM
7th Edition
ISBN: 9781323839577
Author: Larson
Publisher: Pearson Custom Publishing
expand_more
expand_more
format_list_bulleted
Videos
Textbook Question
Chapter 4.1, Problem 24E
Unusual
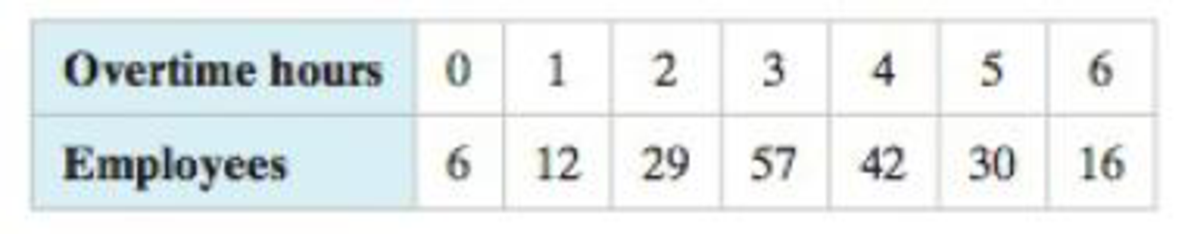
20. Overtime Hours The number of overtime hours worked in one week per employee
Expert Solution & Answer
Want to see the full answer?
Check out a sample textbook solution
Students have asked these similar questions
Suppose you are gambling on a roulette wheel. Each time the wheel is spun, the result is one of the outcomes 0, 1, and so on through 36. Of these outcomes, 18 are red, 18 are black, and 1 is green. On each spin you bet $5 that a red outcome will occur and $1 that the green outcome will occur. If red occurs, you win a net $4. (You win $10 from red and nothing from green.) If green occurs, you win a net $24. (You win $30 from green and nothing from red.) If black occurs, you lose everything you bet for a loss of $6.
a. Use simulation to generate 1,000 plays from this strategy. Each play should indicate the net amount won or lost. Then, based on these outcomes, calculate a 95% confidence interval for the total net amount won or lost from 1,000 plays of the game. (Round your answers to two decimal places and if your answer is negative value, enter "minus" sign.) I worked out the Upper Limit, but I can't seem to arrive at the correct answer for the Lower Limit. What is the Lower Limit?…
Let us suppose we have some article reported on a study of potential sources of injury to equine veterinarians conducted at a
university veterinary hospital. Forces on the hand were measured for several common activities that veterinarians engage in when
examining or treating horses. We will consider the forces on the hands for two tasks, lifting and using ultrasound. Assume that both
sample sizes are 6, the sample mean force for lifting was 6.2 pounds with standard deviation 1.5 pounds, and the sample mean force
for using ultrasound was 6.4 pounds with standard deviation 0.3 pounds. Assume that the standard deviations are known.
Suppose that you wanted to detect a true difference in mean force of 0.25 pounds on the hands for these two activities. Under the null
hypothesis, 40 0. What level of type II error would you recommend here?
=
Round your answer to four decimal places (e.g. 98.7654). Use α = 0.05.
β
= 0.0594
What sample size would be required?
Assume the sample sizes are to be…
Consider the hypothesis test Ho: 0
s² =
=
4.5; s² = 2.3. Use a
= 0.01.
=
σ against H₁: 6 > σ2. Suppose that the sample sizes are n₁ =
20 and 2
= 8, and that
(a) Test the hypothesis.
Round your answers to two decimal places (e.g. 98.76).
The test statistic is fo
=
1.96
The critical value is f
=
6.18
Conclusion:
fail to reject
the null hypothesis at a = 0.01.
(b) Construct the confidence interval on 02/2/622 which can be used to test the hypothesis:
(Round your answer to two decimal places (e.g. 98.76).)
035
Chapter 4 Solutions
ELEMENTARY STATISTICS W/MYMATHLAB<CUSTM
Ch. 4.1 - Determine whether each random variable x is...Ch. 4.1 - A company tracks the number of sales new employees...Ch. 4.1 - Verify that the distribution you constructed in...Ch. 4.1 - Determine whether each distribution is a...Ch. 4.1 - Find the mean of the probability distribution you...Ch. 4.1 - Find the variance and standard deviation of the...Ch. 4.1 - At a raffle, 2000 tickets are sold at 5 each for...Ch. 4.1 - What is a random variable? Give an example of a...Ch. 4.1 - What is a discrete probability distribution? What...Ch. 4.1 - Is the expected value of the probability...
Ch. 4.1 - What does the mean of a probability distribution...Ch. 4.1 - True or False? In Exercises 58, determine whether...Ch. 4.1 - True or False? In Exercises 58, determine whether...Ch. 4.1 - True or False? In Exercises 58, determine whether...Ch. 4.1 - True or False? In Exercises 58, determine whether...Ch. 4.1 - Graphical Analysis In Exercises 912, determine...Ch. 4.1 - Graphical Analysis In Exercises 912, determine...Ch. 4.1 - Graphical Analysis In Exercises 912, determine...Ch. 4.1 - Graphical Analysis In Exercises 912, determine...Ch. 4.1 - Discrete Variables and Continuous Variables In...Ch. 4.1 - Discrete Variables and Continuous Variables In...Ch. 4.1 - Discrete Variables and Continuous Variables In...Ch. 4.1 - Discrete Variables and Continuous Variables In...Ch. 4.1 - Discrete Variables and Continuous Variables In...Ch. 4.1 - Discrete Variables and Continuous Variables In...Ch. 4.1 - Constructing and Graphing Discrete Probability...Ch. 4.1 - Constructing and Graphing Discrete Probability...Ch. 4.1 - Finding Probabilities Use the probability...Ch. 4.1 - Finding Probabilities Use the probability...Ch. 4.1 - Unusual Events In Exercise 19, would it be unusual...Ch. 4.1 - Unusual Events In Exercise 20, would it be unusual...Ch. 4.1 - Determining a Missing Probability In Exercises 25...Ch. 4.1 - Determining a Missing Probability In Exercises 25...Ch. 4.1 - Identifying Probability Distributions In Exercises...Ch. 4.1 - Identifying Probability Distributions In Exercises...Ch. 4.1 - Finding the Mean, Variance, and Standard Deviation...Ch. 4.1 - Baseball The number of games played in each World...Ch. 4.1 - Finding the Mean, Variance, and Standard Deviation...Ch. 4.1 - Finding the Mean, Variance, and Standard Deviation...Ch. 4.1 - Hurricanes The histogram shows the distribution of...Ch. 4.1 - Reviewer Ratings The histogram shows the reviewer...Ch. 4.1 - Writing The expected value of an accountants...Ch. 4.1 - Writing In a game of chance, what is the...Ch. 4.1 - Finding an Expected Value In Exercises 37and 38,...Ch. 4.1 - A high school basketball team is selling 10 raffle...Ch. 4.1 - Linear Transformation of a Random Variable In...Ch. 4.1 - Prob. 40ECh. 4.1 - What is the average sum of their scores? What is...Ch. 4.1 - What is the standard deviation of the difference...Ch. 4.2 - Determine whether the experiment is a binomial...Ch. 4.2 - A card is selected from a standard deck and...Ch. 4.2 - A survey found that 52% of U.S. adults associate...Ch. 4.2 - The survey in Example 5 found that 27% of U.S....Ch. 4.2 - About 5% of workers (ages 16 years and older) in...Ch. 4.2 - A recent study found that 28% of U.S. adults read...Ch. 4.2 - In San Francisco, California, about 44% of the...Ch. 4.2 - In a binomial experiment, what does it mean to say...Ch. 4.2 - In a binomial experiment with n trials, what does...Ch. 4.2 - Graphical Analysis In Exercises 35, the histogram...Ch. 4.2 - Graphical Analysis In Exercises 35, the histogram...Ch. 4.2 - Graphical Analysis In Exercises 35, the histogram...Ch. 4.2 - Graphical Analysis In Exercises 68, the histogram...Ch. 4.2 - Graphical Analysis In Exercises 68, the histogram...Ch. 4.2 - Graphical Analysis In Exercises 68, the histogram...Ch. 4.2 - Identify the unusual values of x in each histogram...Ch. 4.2 - Identify the unusual values of x in each histogram...Ch. 4.2 - Mean, Variance, and Standard Deviation In...Ch. 4.2 - Mean, Variance, and Standard Deviation In...Ch. 4.2 - Mean, Variance, and Standard Deviation In...Ch. 4.2 - Mean, Variance, and Standard Deviation In...Ch. 4.2 - Identifying and Understanding Binomial Experiments...Ch. 4.2 - Identifying and Understanding Binomial Experiments...Ch. 4.2 - Identifying and Understanding Binomial Experiments...Ch. 4.2 - Identifying and Understanding Binomial Experiments...Ch. 4.2 - Finding Binomial Probabilities In Exercises 1926,...Ch. 4.2 - Finding Binomial Probabilities In Exercises 1926,...Ch. 4.2 - Finding Binomial Probabilities In Exercises 1926,...Ch. 4.2 - Finding Binomial Probabilities In Exercises 1926,...Ch. 4.2 - Finding Binomial Probabilities In Exercises 1926,...Ch. 4.2 - Finding Binomial Probabilities In Exercises 1926,...Ch. 4.2 - Finding Binomial Probabilities In Exercises 1926,...Ch. 4.2 - Finding Binomial Probabilities In Exercises 1926,...Ch. 4.2 - Constructing and Graphing Binomial Distributions...Ch. 4.2 - Constructing and Graphing Binomial Distributions...Ch. 4.2 - Constructing and Graphing Binomial Distributions...Ch. 4.2 - Constructing and Graphing Binomial Distributions...Ch. 4.2 - Finding and Interpreting Mean, Variance, and...Ch. 4.2 - Finding and Interpreting Mean, Variance, and...Ch. 4.2 - Finding and Interpreting Mean, Variance, and...Ch. 4.2 - Finding and Interpreting Mean, Variance, and...Ch. 4.2 - Finding and Interpreting Mean, Variance, and...Ch. 4.2 - Finding and Interpreting Mean, Variance, and...Ch. 4.2 - Genetics According to a theory in genetics, when...Ch. 4.2 - Genetics Another proposed theory in genetics gives...Ch. 4.2 - Manufacturing An assembly line produces 10,000...Ch. 4.2 - Prob. 1ACh. 4.2 - Prob. 2ACh. 4.2 - For the election in Exercise 1, simulate selecting...Ch. 4.2 - 1. Construct a probability distribution for the...Ch. 4.2 - 2. Construct binomial probability distributions...Ch. 4.2 - 3. Compare your distributions from Exercise 1 and...Ch. 4.2 - 4. During the 2016 regular season, Kris Bryant of...Ch. 4.3 - The study in Example 1 found that the smartphones...Ch. 4.3 - What is the probability that more than four...Ch. 4.3 - Two thousand brown trout are introduced into a...Ch. 4.3 - In Exercises 14, find the indicated probability...Ch. 4.3 - Prob. 2ECh. 4.3 - In Exercises 14, find the indicated probability...Ch. 4.3 - Prob. 4ECh. 4.3 - In Exercises 58, find the indicated probability...Ch. 4.3 - Prob. 6ECh. 4.3 - In Exercises 58, find the indicated probability...Ch. 4.3 - In Exercises 58, find the indicated probability...Ch. 4.3 - Prob. 9ECh. 4.3 - In your own words, describe the difference between...Ch. 4.3 - Prob. 11ECh. 4.3 - Using a Distribution to Find Probabilities In...Ch. 4.3 - Using a Distribution to Find Probabilities In...Ch. 4.3 - Using a Distribution to Find Probabilities In...Ch. 4.3 - Using a Distribution to Find Probabilities In...Ch. 4.3 - Using a Distribution to Find Probabilities In...Ch. 4.3 - Using a Distribution to Find Probabilities In...Ch. 4.3 - Using a Distribution to Find Probabilities In...Ch. 4.3 - Using a Distribution to Find Probabilities In...Ch. 4.3 - Using a Distribution to Find Probabilities In...Ch. 4.3 - Using a Distribution to Find Probabilities In...Ch. 4.3 - Using a Distribution to Find Probabilities In...Ch. 4.3 - Using a Distribution to Find Probabilities In...Ch. 4.3 - Using a Distribution to Find Probabilities In...Ch. 4.3 - Using a Distribution to Find Probabilities In...Ch. 4.3 - Using a Distribution to Find Probabilities In...Ch. 4.3 - Comparing Binomial and Poisson Distributions An...Ch. 4.3 - Hypergeometric Distribution Binomial experiments...Ch. 4.3 - Geometric Distribution: Mean and Variance In...Ch. 4.3 - Geometric Distribution: Mean and Variance In...Ch. 4.3 - Prob. 31ECh. 4.3 - Geometric Distribution: Mean and Variance In...Ch. 4 - In Exercises 13, assume the fire department...Ch. 4 - In Exercises 13, assume the fire department...Ch. 4 - In Exercises 13, assume the fire department...Ch. 4 - In Exercises 1 and 2, determine whether the random...Ch. 4 - In Exercises 1 and 2, determine whether the random...Ch. 4 - In Exercises 3 and 4, (a) construct a probability...Ch. 4 - In Exercises 3 and 4, (a) construct a probability...Ch. 4 - In Exercises 5 and 6, determine whether the...Ch. 4 - In Exercises 5 and 6, determine whether the...Ch. 4 - In Exercises 7 and 8, (a) find the mean, variance,...Ch. 4 - In Exercises 7 and 8, (a) find the mean, variance,...Ch. 4 - In Exercises 9 and 10, find the expected net gain...Ch. 4 - In Exercises 9 and 10, find the expected net gain...Ch. 4 - In Exercises 11 and 12, determine whether the...Ch. 4 - In Exercises 11 and 12, determine whether the...Ch. 4 - In Exercises 1316, find the indicated binomial...Ch. 4 - In Exercises 1316, find the indicated binomial...Ch. 4 - In Exercises 1316, find the indicated binomial...Ch. 4 - In Exercises 1316, find the indicated binomial...Ch. 4 - In Exercises 17 and 18, (a) construct a binomial...Ch. 4 - In Exercises 17 and 18, (a) construct a binomial...Ch. 4 - In Exercises 19 and 20, find the mean, variance,...Ch. 4 - In Exercises 19 and 20, find the mean, variance,...Ch. 4 - In Exercises 2126, find the indicated...Ch. 4 - Prob. 4.3.22RECh. 4 - In Exercises 2126, find the indicated...Ch. 4 - Prob. 4.3.24RECh. 4 - Prob. 4.3.25RECh. 4 - In Exercises 2126, find the indicated...Ch. 4 - Determine whether the random variable x is...Ch. 4 - The table lists the number of wireless devices per...Ch. 4 - Prob. 3CQCh. 4 - The five-year success rate of kidney transplant...Ch. 4 - An online magazine finds that the mean number of...Ch. 4 - Basketball player Dwight Howard makes a free throw...Ch. 4 - Which event(s) in Exercise 6 can be considered...Ch. 4 - In Exercises 13find the indicated probabilities...Ch. 4 - In Exercises 13, find the indicated probabilities...Ch. 4 - In Exercises 13find the indicated probabilities...Ch. 4 - Determine whether the distribution is a...Ch. 4 - The table shows the ages of students in a freshman...Ch. 4 - Seventy-seven percent of U.S. college students pay...Ch. 4 - The Centers for Disease Control and Prevention...Ch. 4 - The Centers for Disease Control and Prevention...Ch. 4 - Suspicious Samples? A lab worker tells you that...Ch. 4 - In Exercises 17, consider a grocery store that can...Ch. 4 - In Exercises 17, consider a grocery store that can...Ch. 4 - Prob. 3TCh. 4 - Prob. 4TCh. 4 - Prob. 5TCh. 4 - In Exercises 17, consider a grocery store that can...Ch. 4 - In Exercises 17, consider a grocery store that can...
Knowledge Booster


Learn more about
Need a deep-dive on the concept behind this application? Look no further. Learn more about this topic, statistics and related others by exploring similar questions and additional content below.Similar questions
- Using the method of sections need help solving this please explain im stuckarrow_forwardPlease solve 6.31 by using the method of sections im stuck and need explanationarrow_forwarda) When two variables are correlated, can the researcher be sure that one variable causes the other? If YES , why? If NO , why? b) What is meant by the statement that two variables are related? Discuss.arrow_forward
- SCIE 211 Lab 3: Graphing and DataWorksheetPre-lab Questions:1. When should you use each of the following types of graphs? Fill answers in the table below.Type of Graph Used to showLine graphScatter plotBar graphHistogramPie Chart2. Several ways in which we can be fooled or misled by a graph were identified in the Lab 3Introduction. Find two examples of misleading graphs on the Internet and paste them below. Besure to identify why each graph is misleading. Data Charts:Circumference vs. Diameter for circular objectsDiameter Can 1 (cm) Can 2 (cm) Can 3 (cm)Trial 1Trial 2Trial 3MeanCircumference Can 1 (cm) Can 2 (cm) Can 3 (cm)Trial 1Trial 2Trial 3MeanScatter Plot Graph – Circumference Vs. DiameterIdentify 2 points of the Trendline.Y1 = ________ Y2 = _________X1 = ________ X2 = _________Calculate the Slope of the Trendline = Post-lab Questions:1. Answer the questions below. You will need to use the following equation to answer…arrow_forwardThe U.S. Bureau of Labor Statistics reports that 11.3% of U.S. workers belong to unions (BLS website, January 2014). Suppose a sample of 400 U.S. workers is collected in 2014 to determine whether union efforts to organize have increased union membership. a. Formulate the hypotheses that can be used to determine whether union membership increased in 2014.H 0: p H a: p b. If the sample results show that 52 of the workers belonged to unions, what is the p-value for your hypothesis test (to 4 decimals)?arrow_forwardA company manages an electronic equipment store and has ordered 200200 LCD TVs for a special sale. The list price for each TV is $200200 with a trade discount series of 6 divided by 10 divided by 2.6/10/2. Find the net price of the order by using the net decimal equivalent.arrow_forward
- According to flightstats.com, American Airlines flights from Dallas to Chicago are on time 80% of the time. Suppose 10 flights are randomly selected, and the number of on-time flights is recorded. (a) Explain why this is a binomial experiment. (b) Determine the values of n and p. (c) Find and interpret the probability that exactly 6 flights are on time. (d) Find and interpret the probability that fewer than 6 flights are on time. (e) Find and interpret the probability that at least 6 flights are on time. (f) Find and interpret the probability that between 4 and 6 flights, inclusive, are on time.arrow_forwardShow how you get critical values of 1.65, -1.65, and $1.96 for a right-tailed, left- tailed, and two-tailed hypothesis test (use a = 0.05 and assume a large sample size).arrow_forwardSuppose that a sports reporter claims the average football game lasts 3 hours, and you believe it's more than that. Your random sample of 35 games has an average time of 3.25 hours. Assume that the population standard deviation is 1 hour. Use a = 0.05. What do you conclude?arrow_forward
- Suppose that a pizza place claims its average pizza delivery time is 30 minutes, but you believe it takes longer than that. Your sample of 10 pizzas has an average delivery time of 40 minutes. Assume that the population standard deviation is 15 minutes and the times have a normal distribution. Use a = 0.05. a. What are your null and alternative hypotheses? b. What is the critical value? c. What is the test statistic? d. What is the conclusion?arrow_forwardTable 5: Measurement Data for Question 9 Part Number Op-1, M-1 Op-1, M-2 | Op-2, M-1 Op-2, M-2 | Op-3, M-1 Op-3, M-2 1 21 20 20 20 19 21 2 24 23 24 24 23 24 3 4 5 6 7 8 9 10 11 21 12 8222332 201 21 20 22 20 22 27 27 28 26 27 28 19 18 19 21 24 21 22 19 17 18 24 23 25 25 23 26 20 20 18 19 17 13 23 25 25 2 3 3 3 3 2 3 18 18 21 21 23 22 24 22 20 19 23 24 25 24 20 21 19 18 25 25 14 24 24 23 25 24 15 29 30 30 28 31 16 26 26 25 26 25 17 20 20 19 20 20 843882388 20 18 25 20 19 25 25 30 27 20 18 19 21 19 19 21 23 19 25 26 25 24 25 25 20 19 19 18 17 19 17 Question 9 A measurement systems experiment involving 20 parts, three operators (Op-1, Op-2, Op-3), and two measure- ments (M-1, M-2) per part is shown in Table 5. (a) Estimate the repeatability and reproducibility of the gauge. (b) What is the estimate of total gauge variability?" (c) If the product specifications are at LSL = 6 and USL 60, what can you say about gauge capability?arrow_forwardQuestion 5 A fraction nonconforming control chart with center line 0.10, UCL = 0.19, and LCL = 0.01 is used to control a process. (a) If three-sigma limits are used, find the sample size for the control charte 2 (b) Use the Poisson approximation to the binomial to find the probability of type I error. (c) Use the Poisson approximation to the binomial to find the probability of type II error if the process fraction defective is actually p = 0.20.arrow_forward
arrow_back_ios
SEE MORE QUESTIONS
arrow_forward_ios
Recommended textbooks for you
 Holt Mcdougal Larson Pre-algebra: Student Edition...AlgebraISBN:9780547587776Author:HOLT MCDOUGALPublisher:HOLT MCDOUGAL
 Functions and Change: A Modeling Approach to Coll...AlgebraISBN:9781337111348Author:Bruce Crauder, Benny Evans, Alan NoellPublisher:Cengage Learning
 Big Ideas Math A Bridge To Success Algebra 1: Stu...AlgebraISBN:9781680331141Author:HOUGHTON MIFFLIN HARCOURTPublisher:Houghton Mifflin Harcourt
 Glencoe Algebra 1, Student Edition, 9780079039897...AlgebraISBN:9780079039897Author:CarterPublisher:McGraw Hill
 Trigonometry (MindTap Course List)TrigonometryISBN:9781337278461Author:Ron LarsonPublisher:Cengage Learning
Holt Mcdougal Larson Pre-algebra: Student Edition...
Algebra
ISBN:9780547587776
Author:HOLT MCDOUGAL
Publisher:HOLT MCDOUGAL
Functions and Change: A Modeling Approach to Coll...
Algebra
ISBN:9781337111348
Author:Bruce Crauder, Benny Evans, Alan Noell
Publisher:Cengage Learning
Big Ideas Math A Bridge To Success Algebra 1: Stu...
Algebra
ISBN:9781680331141
Author:HOUGHTON MIFFLIN HARCOURT
Publisher:Houghton Mifflin Harcourt
Glencoe Algebra 1, Student Edition, 9780079039897...
Algebra
ISBN:9780079039897
Author:Carter
Publisher:McGraw Hill
Trigonometry (MindTap Course List)
Trigonometry
ISBN:9781337278461
Author:Ron Larson
Publisher:Cengage Learning
Hypothesis Testing using Confidence Interval Approach; Author: BUM2413 Applied Statistics UMP;https://www.youtube.com/watch?v=Hq1l3e9pLyY;License: Standard YouTube License, CC-BY
Hypothesis Testing - Difference of Two Means - Student's -Distribution & Normal Distribution; Author: The Organic Chemistry Tutor;https://www.youtube.com/watch?v=UcZwyzwWU7o;License: Standard Youtube License