Probability and Statistics for Engineers and Scientists
9th Edition
ISBN: 9780321629111
Author: Ronald E. Walpole, Raymond H. Myers, Sharon L. Myers, Keying Ye
Publisher: Prentice Hall
expand_more
expand_more
format_list_bulleted
Textbook Question
Chapter 4.1, Problem 23E
Suppose that X and Y have the following joint probability
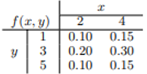
- Find the expected value of g(X, Y) = XY2.
- Find µXand µY.
Expert Solution & Answer

Learn your wayIncludes step-by-step video

schedule04:45
Students have asked these similar questions
Harvard University
California Institute of Technology
Massachusetts Institute of Technology
Stanford University
Princeton University
University of Cambridge
University of Oxford
University of California, Berkeley
Imperial College London
Yale University
University of California, Los Angeles
University of Chicago
Johns Hopkins University
Cornell University
ETH Zurich
University of Michigan
University of Toronto
Columbia University
University of Pennsylvania
Carnegie Mellon University
University of Hong Kong
University College London
University of Washington
Duke University
Northwestern University
University of Tokyo
Georgia Institute of Technology
Pohang University of Science and Technology
University of California, Santa Barbara
University of British Columbia
University of North Carolina at Chapel Hill
University of California, San Diego
University of Illinois at Urbana-Champaign
National University of Singapore
McGill…
Name
Harvard University
California Institute of Technology
Massachusetts Institute of Technology
Stanford University
Princeton University
University of Cambridge
University of Oxford
University of California, Berkeley
Imperial College London
Yale University
University of California, Los Angeles
University of Chicago
Johns Hopkins University
Cornell University
ETH Zurich
University of Michigan
University of Toronto
Columbia University
University of Pennsylvania
Carnegie Mellon University
University of Hong Kong
University College London
University of Washington
Duke University
Northwestern University
University of Tokyo
Georgia Institute of Technology
Pohang University of Science and Technology
University of California, Santa Barbara
University of British Columbia
University of North Carolina at Chapel Hill
University of California, San Diego
University of Illinois at Urbana-Champaign
National University of Singapore…
A company found that the daily sales revenue of its flagship product follows a normal distribution with a mean of $4500 and a standard deviation of $450. The company defines a "high-sales day" that is, any day with sales exceeding $4800. please provide a step by step on how to get the answers in excel
Q: What percentage of days can the company expect to have "high-sales days" or sales greater than $4800?
Q: What is the sales revenue threshold for the bottom 10% of days? (please note that 10% refers to the probability/area under bell curve towards the lower tail of bell curve)
Provide answers in the yellow cells
Chapter 4 Solutions
Probability and Statistics for Engineers and Scientists
Ch. 4.1 - The probability distribution of X, the number of...Ch. 4.1 - The probability distribution of the discrete...Ch. 4.1 - Find the mean of the random variable T...Ch. 4.1 - Prob. 4ECh. 4.1 - Prob. 5ECh. 4.1 - Prob. 6ECh. 4.1 - Prob. 7ECh. 4.1 - Prob. 8ECh. 4.1 - A private pilot wishes to insure his airplane for...Ch. 4.1 - Prob. 10E
Ch. 4.1 - The density function of coded measurements of the...Ch. 4.1 - Prob. 12ECh. 4.1 - Prob. 13ECh. 4.1 - Find the proportion X of individuals who can be...Ch. 4.1 - Prob. 15ECh. 4.1 - Prob. 16ECh. 4.1 - Let X be a random variable with the following...Ch. 4.1 - Find the expected value of the random variable...Ch. 4.1 - Prob. 19ECh. 4.1 - Prob. 20ECh. 4.1 - Prob. 21ECh. 4.1 - The hospitalization period, in days, for patients...Ch. 4.1 - Suppose that X and Y have the following joint...Ch. 4.1 - Prob. 24ECh. 4.1 - Prob. 25ECh. 4.1 - Prob. 26ECh. 4.1 - In Exercise 3.27 on page 93, a density function is...Ch. 4.1 - Prob. 28ECh. 4.1 - Prob. 29ECh. 4.1 - Prob. 30ECh. 4.1 - Prob. 31ECh. 4.1 - Prob. 32ECh. 4.2 - Use Definition 4.3 on page 120 to find the...Ch. 4.2 - Let X be a random variable with the following...Ch. 4.2 - Prob. 35ECh. 4.2 - Prob. 36ECh. 4.2 - Prob. 37ECh. 4.2 - Prob. 38ECh. 4.2 - Prob. 39ECh. 4.2 - Referring to Exercise 4.14 on page 117, find for...Ch. 4.2 - Prob. 41ECh. 4.2 - Prob. 42ECh. 4.2 - Prob. 43ECh. 4.2 - Prob. 44ECh. 4.2 - Find the covariance of the random variables X and...Ch. 4.2 - Prob. 46ECh. 4.2 - Prob. 47ECh. 4.2 - Prob. 48ECh. 4.2 - Prob. 49ECh. 4.2 - Prob. 50ECh. 4.2 - For the random variables X and Y in Exercise 3.39...Ch. 4.2 - Random variables X and Y follow a joint...Ch. 4.4 - Referring to Exercise 4.35 on page 127, find the...Ch. 4.4 - Using Theorem 4.5 and Corollary 4.6, find the mean...Ch. 4.4 - Suppose that a grocery store purchases 5 cartons...Ch. 4.4 - Prob. 56ECh. 4.4 - Prob. 57ECh. 4.4 - The total time, measured in units of 100 hours,...Ch. 4.4 - Prob. 59ECh. 4.4 - Prob. 60ECh. 4.4 - Prob. 61ECh. 4.4 - Prob. 62ECh. 4.4 - Prob. 63ECh. 4.4 - Prob. 64ECh. 4.4 - Prob. 65ECh. 4.4 - Prob. 66ECh. 4.4 - Prob. 67ECh. 4.4 - Prob. 68ECh. 4.4 - Prob. 69ECh. 4.4 - Prob. 70ECh. 4.4 - Prob. 71ECh. 4.4 - Prob. 72ECh. 4.4 - Prob. 73ECh. 4.4 - Prob. 74ECh. 4.4 - Prob. 75ECh. 4.4 - Prob. 76ECh. 4.4 - Prob. 77ECh. 4.4 - Compute P(μ − 2σ < X < μ + 2σ), where X has the...Ch. 4.4 - Prob. 79RECh. 4.4 - Prob. 80RECh. 4.4 - Prob. 81RECh. 4.4 - Prob. 82RECh. 4.4 - Prob. 83RECh. 4.4 - Prob. 84RECh. 4.4 - Prob. 85RECh. 4.4 - Prob. 86RECh. 4.4 - Prob. 87RECh. 4.4 - Prob. 88RECh. 4.4 - Prob. 89RECh. 4.4 - Prob. 90RECh. 4.4 - Prob. 91RECh. 4.4 - Prob. 92RECh. 4.4 - Prob. 93RECh. 4.4 - Prob. 94RECh. 4.4 - Prob. 95RECh. 4.4 - Prob. 96RECh. 4.4 - Prob. 97RECh. 4.4 - Prob. 98RECh. 4.4 - Prob. 99RECh. 4.4 - Prob. 100RECh. 4.4 - Prob. 101RECh. 4.4 - Project: Let X = number of hours each student in...
Additional Math Textbook Solutions
Find more solutions based on key concepts
Assessment 1-1A Cookies are sold singly or in packages of 2 or 6. With this packaging, how many ways can you bu...
A Problem Solving Approach To Mathematics For Elementary School Teachers (13th Edition)
Ages A study of all the students at a small college showed a mean age of 20.7 and a standard deviation of 2.5 y...
Introductory Statistics
CHECK POINT I Let p and q represent the following statements: p : 3 + 5 = 8 q : 2 × 7 = 20. Determine the truth...
Thinking Mathematically (6th Edition)
In Exercises 25–28, use the confidence interval to find the margin of error and the sample mean.
25. (12.0, 14....
Elementary Statistics: Picturing the World (7th Edition)
Fill in each blank so that the resulting statement is true. An equation that expresses a relationship between t...
Algebra and Trigonometry (6th Edition)
Knowledge Booster

Similar questions
- Find the critical value for a left-tailed test using the F distribution with a 0.025, degrees of freedom in the numerator=12, and degrees of freedom in the denominator = 50. A portion of the table of critical values of the F-distribution is provided. Click the icon to view the partial table of critical values of the F-distribution. What is the critical value? (Round to two decimal places as needed.)arrow_forwardA retail store manager claims that the average daily sales of the store are $1,500. You aim to test whether the actual average daily sales differ significantly from this claimed value. You can provide your answer by inserting a text box and the answer must include: Null hypothesis, Alternative hypothesis, Show answer (output table/summary table), and Conclusion based on the P value. Showing the calculation is a must. If calculation is missing,so please provide a step by step on the answers Numerical answers in the yellow cellsarrow_forwardShow all workarrow_forward
- Show all workarrow_forwardplease find the answers for the yellows boxes using the information and the picture belowarrow_forwardA marketing agency wants to determine whether different advertising platforms generate significantly different levels of customer engagement. The agency measures the average number of daily clicks on ads for three platforms: Social Media, Search Engines, and Email Campaigns. The agency collects data on daily clicks for each platform over a 10-day period and wants to test whether there is a statistically significant difference in the mean number of daily clicks among these platforms. Conduct ANOVA test. You can provide your answer by inserting a text box and the answer must include: also please provide a step by on getting the answers in excel Null hypothesis, Alternative hypothesis, Show answer (output table/summary table), and Conclusion based on the P value.arrow_forward
arrow_back_ios
SEE MORE QUESTIONS
arrow_forward_ios
Recommended textbooks for you
 Glencoe Algebra 1, Student Edition, 9780079039897...AlgebraISBN:9780079039897Author:CarterPublisher:McGraw Hill
Glencoe Algebra 1, Student Edition, 9780079039897...
Algebra
ISBN:9780079039897
Author:Carter
Publisher:McGraw Hill