
(a)
The variables in the graph and the relation of variables at various points on the graph are to be determined.
(a)
Explanation of Solution
The graph given in the question is,
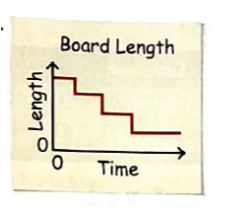
The graph is between length and time.
The given graph represents the variation of length of a board with time. The time is plotted on the x-axis while length is plotted on the y-axis.
The variables in the graph are length and time.
The length of the board remains constant over a shot time interval and as the length keeps on decreasing the time interval in which the length of the board remainsconstant,increases.
The variation of length of board in the different timeinterval is shown below:
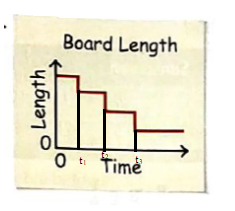
After a time interval (t3-t2) the length of the board remains constant with respect to time.
(b)
The variables in the graph and the relation of variables at various points on the graph are to be determined.
(b)
Explanation of Solution
The graph given in the question is,
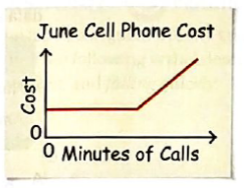
The given graph represents the cell phone cost of June month with respect to minutes of calls.
The variables are cost and minutes of calls.
The graph represents that the cell phone cost is fixed up to half month of June with respect to number of calls and the cost starts to rise linearly in the rest of the month with respect to minutes of calls.
Chapter 4 Solutions
High School Math 2011 Algebra 1(prentice Hall) Student Edition
Additional Math Textbook Solutions
Elementary Statistics: Picturing the World (7th Edition)
Elementary Statistics
A First Course in Probability (10th Edition)
Calculus for Business, Economics, Life Sciences, and Social Sciences (14th Edition)
Introductory Statistics
College Algebra with Modeling & Visualization (5th Edition)

- In simplest terms, Sketch the graph of the parabola. Then, determine its equation. opens downward, vertex is (- 4, 7), passes through point (0, - 39)arrow_forwardIn simplest way, For each quadratic relation, find the zeros and the maximum or minimum. a) y = x 2 + 16 x + 39 b) y = 5 x2 - 50 x - 120arrow_forwardIn simplest terms and step by step Write each quadratic relation in standard form, then fi nd the zeros. y = - 4( x + 6)2 + 36arrow_forward
- In simplest terms and step by step For each quadratic relation, find the zeros and the maximum or minimum. 1) y = - 2 x2 - 28 x + 64 2) y = 6 x2 + 36 x - 42arrow_forwardWrite each relation in standard form a)y = 5(x + 10)2 + 7 b)y = 9(x - 8)2 - 4arrow_forwardIn simplest form and step by step Write the quadratic relation in standard form, then fi nd the zeros. y = 3(x - 1)2 - 147arrow_forward
- Step by step instructions The path of a soccer ball can be modelled by the relation h = - 0.1 d 2 + 0.5 d + 0.6, where h is the ball’s height and d is the horizontal distance from the kicker. a) Find the zeros of the relation.arrow_forwardIn simplest terms and step by step how do you find the zeros of y = 6x2 + 24x - 192arrow_forwardStep by step Find the zeros of each quadratic relation. a) y = x2 - 16xarrow_forward
- In simplest step by step terms, how do you find the zeros of y = x2 - 16arrow_forwardIn simplest terms, Describe the shape and position of the parabola relative to the graph of y = x 2 y = - 80( x + 9) 2 + 10.8arrow_forwardas a Identify each equation Parabola, circle, ellipse perbola without completio the square. x²-6x-14 y = 33-y² 14y ofarrow_forward
 Algebra and Trigonometry (6th Edition)AlgebraISBN:9780134463216Author:Robert F. BlitzerPublisher:PEARSON
 Contemporary Abstract AlgebraAlgebraISBN:9781305657960Author:Joseph GallianPublisher:Cengage Learning
 Linear Algebra: A Modern IntroductionAlgebraISBN:9781285463247Author:David PoolePublisher:Cengage Learning
 Algebra And Trigonometry (11th Edition)AlgebraISBN:9780135163078Author:Michael SullivanPublisher:PEARSON
 Introduction to Linear Algebra, Fifth EditionAlgebraISBN:9780980232776Author:Gilbert StrangPublisher:Wellesley-Cambridge Press
 College Algebra (Collegiate Math)AlgebraISBN:9780077836344Author:Julie Miller, Donna GerkenPublisher:McGraw-Hill Education