
The comparative advantage of countries.
Answer to Problem 2P
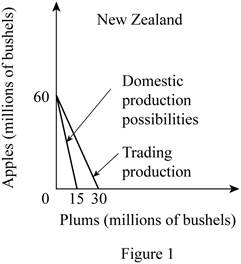
a. New Zealand- The cost of producing 1 Apple is 0.25 plums and the cost of producing 1 plum is 4 Apples.
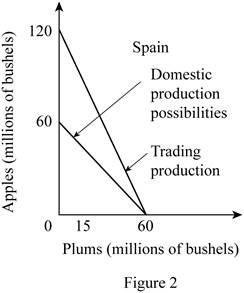
Spain- The cost of producing 1 Apple is 1 plum and the cost of producing 1 plum is 1 Apple.
b. New Zealand should produce apples and Spain should produce plums.
c. Graph
d. The total gain of Apples is 20 and the total gain of plums is 10.
Explanation of Solution
The comparative advantage is the advantage that the country has over the competitor in the
Option (a):
In New Zealand, the production of 20 apples needs the resources which can alternatively be used for the production of 5 plums. Thus, the opportunity cost of producing 1 apple can be calculated by dividing the total units of plums given up by the total units of apples gained as follows:
Thus, the opportunity cost of producing 1 apple in New Zealand is 0.25 plum.
The opportunity cost of producing plum in New Zealand can be calculated by dividing the number of units of apples given up with the number of units of plums gained as follows:
So, the opportunity cost of producing 1 plum in New Zealand is 4 apples.
In Spain, the production of 20 apples needs the resources which can alternatively be used for the production of 20 plums. Thus, the opportunity cost of producing 1 apple can be calculated by dividing the total units of plums given up by the total units of apples gained as follows:
Thus, the opportunity cost of producing 1 apple in Spain is 1 plum.
The opportunity cost of producing plum in Spain can be calculated by dividing the number of units of apples given up with the number of units of plums gained as follows:
So, the opportunity cost of producing 1 plum in Spain is 1 apple.
Option (b):
The opportunity cost of producing a unit of apple is lower in New Zealand (0.25 Plum) compared to Spain (1 Plum). Thus, New Zealand should specialize in the production of apples.
The opportunity cost of producing a unit of plum is lower in Spain (1 Apple) compared to that in New Zealand (4 Apples). Thus, Spain should specialize in the production of plums.
Option (c):
Before the trade, the
According to the terms of trade of
Similarly, Spain can have 2 apples for 1 plum in the international trade which will increase their total possible consumption of apples from 60 million bushels to 120 million bushels. Thus, the vertical intercept of the Spain's production possibility curve will increase to 120 million bushels. So, the slope of the production possibility curve of Spain will decrease from -1 to -0.5.
The changes are shown in the diagram as follows:
Option (d):
The mixed product of New Zealand is B and of Spain is S. According to the table, the total output of apples in New Zealand at this mixed product is 20 million bushels and the output of plums is 10 million bushels. Similarly, at the given output combination S of Spain, the total output of apples is 20 million bushes and of plums is 40 million bushels.
Thus, the total output of the apple and plum before the trade can be calculated by adding the individual quantities of apples that are produced in New Zealand and Spain together are as follows:
Thus, the total output of apples before the trade was 40 million bushels.
Similarly, the total output of plums can be calculated by adding together each country’s outputs are as follows:
Thus, the total output of plums before the trade was 50 million bushels.
After the specialization by New Zealand in the production of apples, the total output of apples increased to 60 million bushels. Similarly, the specialization by Spain in the production of plums increased the total output of plums to 60 million bushels. Thus, total
Thus, the total output gain of apples is 20 million bushels.
Similarly, the total output gain in the case of plums can be calculated as follows:
Thus, the total output gain in plums is 10 million bushels.
Concept introduction:
Comparative advantage: It is the ability of the producer, firm or a country to produce a good or service at the lowest opportunity cost of production than the competitors.
Specialization: It is the process of identifying the product in which, the country has the comparative advantage in the form of lower opportunity cost of production. Thus, they can focus on the production of that commodity which will increase the output and they can engage in an international exchange in order to obtain the products in which they don’t have any comparative advantage.
Want to see more full solutions like this?
Chapter 40 Solutions
Economics (Irwin Economics)

- How Command Economics Relate to Principle Of Economics?arrow_forwardhow commond economies relate to principle Of Economics ?arrow_forwardCritically analyse the five (5) characteristics of Ubuntu and provide examples of how they apply to the National Health Insurance (NHI) in South Africa.arrow_forward
- Critically analyse the five (5) characteristics of Ubuntu and provide examples of how they apply to the National Health Insurance (NHI) in South Africa.arrow_forwardOutline the nine (9) consumer rights as specified in the Consumer Rights Act in South Africa.arrow_forwardIn what ways could you show the attractiveness of Philippines in the form of videos/campaigns to foreign investors? Cite 10 examples.arrow_forward
- Explain the following terms and provide an example for each term: • Corruption • Fraud • Briberyarrow_forwardIn what ways could you show the attractiveness of a country in the form of videos/campaigns?arrow_forwardWith the VBS scenario in mind, debate with your own words the view that stakeholders are the primary reason why business ethics must be implemented.arrow_forward
 Exploring EconomicsEconomicsISBN:9781544336329Author:Robert L. SextonPublisher:SAGE Publications, Inc
 Essentials of Economics (MindTap Course List)EconomicsISBN:9781337091992Author:N. Gregory MankiwPublisher:Cengage Learning
 Brief Principles of Macroeconomics (MindTap Cours...EconomicsISBN:9781337091985Author:N. Gregory MankiwPublisher:Cengage Learning

 Principles of Economics (MindTap Course List)EconomicsISBN:9781305585126Author:N. Gregory MankiwPublisher:Cengage Learning