
ESSENTIALS OF STATISTICS 6TH ED W/MYSTA
6th Edition
ISBN: 9781323845820
Author: Triola
Publisher: PEARSON
expand_more
expand_more
format_list_bulleted
Concept explainers
Videos
Textbook Question
Chapter 4, Problem 8RE
In Exercises 1–10, use the data in the accompanying table and express all results in decimal form. (The data are from “Mortality Reduction with Air Bag and Seat Belt Use in Head-On Passenger Car Collisions,” by Crandall, Olson, and Sklar, American Journal of Epidemiology, Vol. 153, No. 3.)
Drivers Involved in Head-On Collision of Passenger Cars
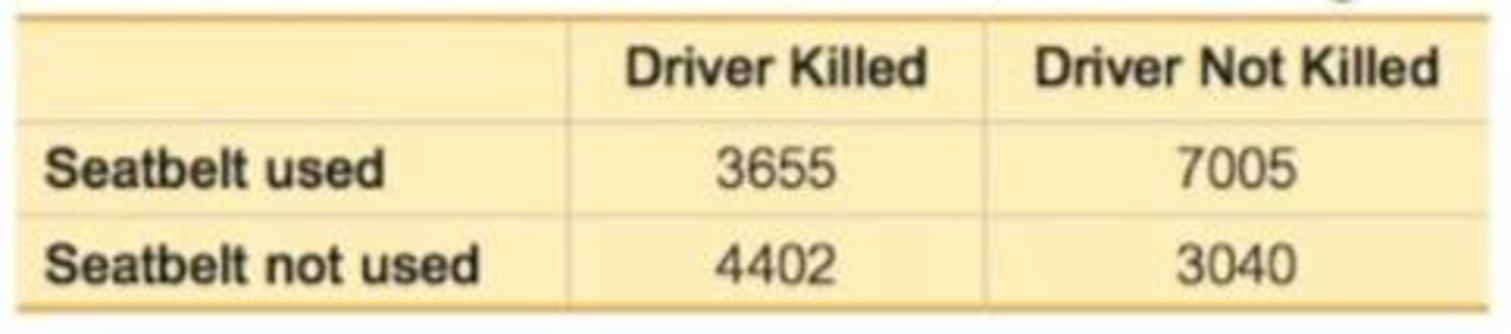
8. Complement If A represents the
Expert Solution & Answer
Want to see the full answer?
Check out a sample textbook solution
Students have asked these similar questions
A retail store manager claims that the average daily sales of the store are $1,500.
You aim to test whether the actual average daily sales differ significantly from this claimed value.
You can provide your answer by inserting a text box and the answer must include:
Null hypothesis,
Alternative hypothesis,
Show answer (output table/summary table), and
Conclusion based on the P value.
Showing the calculation is a must. If calculation is missing,so please provide a step by step on the answers
Numerical answers in the yellow cells
Show all work
Show all work
Chapter 4 Solutions
ESSENTIALS OF STATISTICS 6TH ED W/MYSTA
Ch. 4.1 - New Jersey Lottery Let A denote the event of...Ch. 4.1 - Probability Rewrite the following statement so...Ch. 4.1 - Interpreting Weather While this exercise was being...Ch. 4.1 - Subjective Probability Estimate the probability...Ch. 4.1 - Identifying Probability Values Which of the...Ch. 4.1 - Penicillin Who discovered penicillin: Sean Penn,...Ch. 4.1 - Avogadro Constant If you are asked on a quiz to...Ch. 4.1 - Births Example 2 in this section includes the...Ch. 4.1 - In Exercises 9-12, assume that 50 births are...Ch. 4.1 - In Exercises 9-12, assume that 50 births are...
Ch. 4.1 - In Exercises 9-12, assume that 50 births are...Ch. 4.1 - In Exercises 9-12, assume that 50 births are...Ch. 4.1 - In Exercises 13-20, express the indicated degree...Ch. 4.1 - SAT Test When making a random guess for an answer...Ch. 4.1 - In Exercises 13-20, express the indicated degree...Ch. 4.1 - In Exercises 13-20, express the indicated degree...Ch. 4.1 - Randomness When using a computer to randomly...Ch. 4.1 - In Exercises 13-20, express the indicated degree...Ch. 4.1 - In Exercises 13-20, express the indicated degree...Ch. 4.1 - In Exercises 13-20, express the indicated degree...Ch. 4.1 - In Exercises 21-24, refer to the sample data in...Ch. 4.1 - In Exercises 21-24, refer to the sample data in...Ch. 4.1 - In Exercises 21-24, refer to the sample data in...Ch. 4.1 - In Exercises 21-24, refer to the sample data in...Ch. 4.1 - In Exercises 25-32, find the probability and...Ch. 4.1 - In Exercises 25-32, find the probability and...Ch. 4.1 - In Exercises 25-32, find the probability and...Ch. 4.1 - In Exercises 25-32, find the probability and...Ch. 4.1 - In Exercises 25-32, find the probability and...Ch. 4.1 - In Exercises 25-32, find the probability and...Ch. 4.1 - In Exercises 25-32, find the probability and...Ch. 4.1 - In Exercises 25-32, find the probability and...Ch. 4.1 - Probability from a Sample Space. In Exercises...Ch. 4.1 - Probability from a Sample Space. In Exercises...Ch. 4.1 - Probability from a Sample Space. In Exercises...Ch. 4.1 - Probability from a Sample Space. In Exercises...Ch. 4.1 - Using Probability to Form Conclusions. In...Ch. 4.1 - Using Probability to Form Conclusions. In...Ch. 4.1 - Using Probability to Form Conclusions. In...Ch. 4.1 - Using Probability to Form Conclusions. In...Ch. 4.1 - Kentucky Pick 4 In the Kentucky Pick 4 lottery,...Ch. 4.1 - Finding Odds in Roulette A roulette wheel has 38...Ch. 4.1 - Kentucky Derby Odds When the horse California...Ch. 4.1 - Relative Risk and Odds Ratio In a clinical trial...Ch. 4.2 - Notation When randomly selecting an adult, A...Ch. 4.2 - Notation When randomly selecting adults, let M...Ch. 4.2 - Sample for a Poll There are 15,524,971 adults in...Ch. 4.2 - Rule of Complements When randomly selecting an...Ch. 4.2 - Finding Complements. In Exercises 5-8, find the...Ch. 4.2 - Finding Complements. In Exercises 5-8, find the...Ch. 4.2 - Finding Complements. In Exercises 5-8, find the...Ch. 4.2 - Finding Complements. In Exercises 5-8, find the...Ch. 4.2 - In Exercises 9-20, use the data in the following...Ch. 4.2 - In Exercises 9-20, use the data in the following...Ch. 4.2 - In Exercises 9-20, use the data in the following...Ch. 4.2 - In Exercises 9-20, use the data in the following...Ch. 4.2 - In Exercises 9-20; use the data in the following...Ch. 4.2 - In Exercises 9-20, use the data in the following...Ch. 4.2 - In Exercises 9-20, use the data in the following...Ch. 4.2 - In Exercises 9-20, use the data in the following...Ch. 4.2 - In Exercises 9-20, use the data in the following...Ch. 4.2 - In Exercises 9-20, use the data in the following...Ch. 4.2 - In Exercises 9-20, use the data in the following...Ch. 4.2 - In Exercises 9-20, use the data in the following...Ch. 4.2 - In Exercises 21-24, use these results from the...Ch. 4.2 - In Exercises 21-24, use these results from the...Ch. 4.2 - In Exercises 21-24, use these results from the...Ch. 4.2 - In Exercises 21-24, use these results from the...Ch. 4.2 - Redundancy. Exercises 25 and 26 involve...Ch. 4.2 - Redundancy. Exercises 25 and 26 involve...Ch. 4.2 - Acceptance Sampling. With one method of a...Ch. 4.2 - Acceptance Sampling. With one method of a...Ch. 4.2 - In Exercises 29 and 30, find the probabilities and...Ch. 4.2 - Prob. 30BSCCh. 4.2 - Surge Protectors Refer to the accompanying figure...Ch. 4.2 - Prob. 32BBCh. 4.2 - Exclusive Or The exclusive or means either one or...Ch. 4.2 - Complements and the Addition Rule Refer to the...Ch. 4.3 - Language: Complement of At Least One Let A = the...Ch. 4.3 - Probability of At Least One Let A = the event of...Ch. 4.3 - Notation When selecting one of your Facebook...Ch. 4.3 - Notation When selecting one of your Facebook...Ch. 4.3 - At Least One. In Exercises 5-12, find the...Ch. 4.3 - Probability of a Girl Assuming that boys and girls...Ch. 4.3 - At Least One. In Exercises 5-12, find the...Ch. 4.3 - At Least One. In Exercises 5-12, find the...Ch. 4.3 - At Least One. In Exercises 5-12, find the...Ch. 4.3 - At Least One. In Exercises 5-12, find the...Ch. 4.3 - At Least One. In Exercises 5-12, find the...Ch. 4.3 - At Least One. In Exercises 5-12, find the...Ch. 4.3 - Denomination Effect. In Exercises 13-16, use the...Ch. 4.3 - Denomination Effect. In Exercises 13-16, use the...Ch. 4.3 - Denomination Effect. In Exercises 13-16, use the...Ch. 4.3 - Denomination Effect. In Exercises 13-16, use the...Ch. 4.3 - In Exercises 17-20, refer to the accompanying...Ch. 4.3 - In Exercises 17-20, refer to the accompanying...Ch. 4.3 - In Exercises 17-20, refer to the accompanying...Ch. 4.3 - In Exercises 17-20, refer to the accompanying...Ch. 4.3 - Redundancy in Computer Hard Drives Assume that...Ch. 4.3 - Redundancy in Stadium Generators Large stadiums...Ch. 4.3 - Composite Drug Test Based on the data in Table 4-1...Ch. 4.3 - Composite Water Samples The Fairfield County...Ch. 4.3 - Shared Birthdays Find the probability that of 25...Ch. 4.4 - Notation What does the symbol ! represent? Six...Ch. 4.4 - New Jersey Pick 6 In the New Jersey Pick 6 lottery...Ch. 4.4 - Oregon Pick 4 In the Oregon Pick 4 lottery game, a...Ch. 4.4 - Combination Lock The typical combination lock uses...Ch. 4.4 - In Exercises 536, express all probabilities as...Ch. 4.4 - Social Security Numbers A Social Security number...Ch. 4.4 - Quinela In a horse race, a quinela bet is won if...Ch. 4.4 - Soccer Shootout In soccer, a tie at the end of...Ch. 4.4 - Grading Exams Your professor has just collected...Ch. 4.4 - Radio Station Call Letters If radio station call...Ch. 4.4 - Scheduling Routes A presidential candidate plans...Ch. 4.4 - Survey Reliability A survey with 12 questions is...Ch. 4.4 - Safety with Numbers The author owns a safe in...Ch. 4.4 - Electricity When testing for current in a cable...Ch. 4.4 - Sorting Hat At Hogwarts School of Witchcraft and...Ch. 4.4 - Moving Company The United Van Lines moving company...Ch. 4.4 - Powerball As of this writing, the Powerball...Ch. 4.4 - Teed Off When four golfers are about to begin a...Ch. 4.4 - ZIP Code If you randomly select five digits, each...Ch. 4.4 - FedEx Deliveries With a short time remaining in...Ch. 4.4 - Phone Numbers Current rules for telephone area...Ch. 4.4 - Classic Counting Problem A classic counting...Ch. 4.4 - Corporate Officers and Committees The Digital Pet...Ch. 4.4 - ATM You want to obtain cash by using an ATM, but...Ch. 4.4 - Party Mix DJ Marty T is hosting a party tonight...Ch. 4.4 - Identity Theft with Credit Cards Credit card...Ch. 4.4 - What a Word! One of the longest words in standard...Ch. 4.4 - Phase I of a Clinical Trial A clinical test on...Ch. 4.4 - Mega Millions As of this writing, the Mega...Ch. 4.4 - Designing Experiment Clinical trials of Nasonex...Ch. 4.4 - Morse Codes The International Morse code is a way...Ch. 4.4 - Mendels Peas Mendel conducted some his famous...Ch. 4.4 - Change for a Quarter How many different ways can...Ch. 4.4 - Counting with Fingers How many different ways can...Ch. 4.4 - Change for a Quarter How many different ways can...Ch. 4.4 - Win 1 Billion Quicken Loans offered a prize of 1...Ch. 4.4 - Computer Variable Names A common computer...Ch. 4.4 - High Fives a. Five mathletes celebrate after...Ch. 4 - Standard Tests Standard tests, such as the SAT or...Ch. 4 - Rain As the author is creating this exercise, a...Ch. 4 - Months If a month is randomly selected after...Ch. 4 - Social Networking Based on data from the Pew...Ch. 4 - Subjective Probability Estimate the probability...Ch. 4 - In Exercises 610, use the following results from...Ch. 4 - In Exercises 610, use the following results from...Ch. 4 - In Exercises 610, use the following results from...Ch. 4 - In Exercises 610, use the following results from...Ch. 4 - In Exercises 610, use the following results from...Ch. 4 - In Exercises 110, use the data in the accompanying...Ch. 4 - In Exercises 110, use the data in the accompanying...Ch. 4 - In Exercises 110, use the data in the accompanying...Ch. 4 - In Exercises 110, use the data in the accompanying...Ch. 4 - In Exercises 110, use the data in the accompanying...Ch. 4 - Prob. 6RECh. 4 - Prob. 7RECh. 4 - In Exercises 110, use the data in the accompanying...Ch. 4 - In Exercises 110, use the data in the accompanying...Ch. 4 - Prob. 10RECh. 4 - Black Cars Use subjective probability to estimate...Ch. 4 - Vision Correction About 75% of the U.S. population...Ch. 4 - National Statistics Day a. If a person is randomly...Ch. 4 - Composite Sampling for Diabetes Currently, the...Ch. 4 - Wild Card Lottery The Wild Card lottery is run in...Ch. 4 - Pennsylvania Cash 5 In the Pennsylvania Cash 5...Ch. 4 - Redundancy Using Braun battery-powered alarm...Ch. 4 - Exacta In a horse race, an exacta bet is won by...Ch. 4 - Fatal Drunk Driving Listed below are the blood...Ch. 4 - Fatal Drunk Driving Use the same data given in...Ch. 4 - Organ Donors USA Today provided information about...Ch. 4 - Sampling Eye Color Based on a study by Dr. P....Ch. 4 - Prob. 5CRECh. 4 - New Lottery Game In the Monopoly Millionaires Club...Ch. 4 - Critical Thinking: Interpreting results from a...Ch. 4 - Critical Thinking: Interpreting results from a...Ch. 4 - Critical Thinking: Interpreting results from a...Ch. 4 - Critical Thinking: Interpreting results from a...Ch. 4 - Critical Thinking: Interpreting results from a...Ch. 4 - Critical Thinking: Interpreting results from a...Ch. 4 - Critical Thinking: Interpreting results from a...Ch. 4 - Critical Thinking: Interpreting results from a...Ch. 4 - Critical Thinking: Interpreting results from a...
Knowledge Booster


Learn more about
Need a deep-dive on the concept behind this application? Look no further. Learn more about this topic, statistics and related others by exploring similar questions and additional content below.Similar questions
- please find the answers for the yellows boxes using the information and the picture belowarrow_forwardA marketing agency wants to determine whether different advertising platforms generate significantly different levels of customer engagement. The agency measures the average number of daily clicks on ads for three platforms: Social Media, Search Engines, and Email Campaigns. The agency collects data on daily clicks for each platform over a 10-day period and wants to test whether there is a statistically significant difference in the mean number of daily clicks among these platforms. Conduct ANOVA test. You can provide your answer by inserting a text box and the answer must include: also please provide a step by on getting the answers in excel Null hypothesis, Alternative hypothesis, Show answer (output table/summary table), and Conclusion based on the P value.arrow_forwardA company found that the daily sales revenue of its flagship product follows a normal distribution with a mean of $4500 and a standard deviation of $450. The company defines a "high-sales day" that is, any day with sales exceeding $4800. please provide a step by step on how to get the answers Q: What percentage of days can the company expect to have "high-sales days" or sales greater than $4800? Q: What is the sales revenue threshold for the bottom 10% of days? (please note that 10% refers to the probability/area under bell curve towards the lower tail of bell curve) Provide answers in the yellow cellsarrow_forward
- Business Discussarrow_forwardThe following data represent total ventilation measured in liters of air per minute per square meter of body area for two independent (and randomly chosen) samples. Analyze these data using the appropriate non-parametric hypothesis testarrow_forwardeach column represents before & after measurements on the same individual. Analyze with the appropriate non-parametric hypothesis test for a paired design.arrow_forward
arrow_back_ios
SEE MORE QUESTIONS
arrow_forward_ios
Recommended textbooks for you
 Glencoe Algebra 1, Student Edition, 9780079039897...AlgebraISBN:9780079039897Author:CarterPublisher:McGraw Hill
 Holt Mcdougal Larson Pre-algebra: Student Edition...AlgebraISBN:9780547587776Author:HOLT MCDOUGALPublisher:HOLT MCDOUGAL
 Big Ideas Math A Bridge To Success Algebra 1: Stu...AlgebraISBN:9781680331141Author:HOUGHTON MIFFLIN HARCOURTPublisher:Houghton Mifflin Harcourt
Glencoe Algebra 1, Student Edition, 9780079039897...
Algebra
ISBN:9780079039897
Author:Carter
Publisher:McGraw Hill
Holt Mcdougal Larson Pre-algebra: Student Edition...
Algebra
ISBN:9780547587776
Author:HOLT MCDOUGAL
Publisher:HOLT MCDOUGAL
Big Ideas Math A Bridge To Success Algebra 1: Stu...
Algebra
ISBN:9781680331141
Author:HOUGHTON MIFFLIN HARCOURT
Publisher:Houghton Mifflin Harcourt
Sampling Methods and Bias with Surveys: Crash Course Statistics #10; Author: CrashCourse;https://www.youtube.com/watch?v=Rf-fIpB4D50;License: Standard YouTube License, CC-BY
Statistics: Sampling Methods; Author: Mathispower4u;https://www.youtube.com/watch?v=s6ApdTvgvOs;License: Standard YouTube License, CC-BY