
EBK BUSINESS ANALYTICS
3rd Edition
ISBN: 9780136880844
Author: Evans
Publisher: PEARSON
expand_more
expand_more
format_list_bulleted
Concept explainers
Videos
Textbook Question
Chapter 4, Problem 8PE
A community health status survey obtained the following demographic information from the respondents:
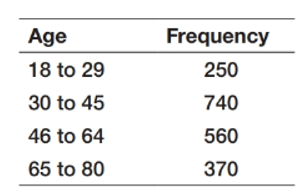
Compute the relative frequencies and cumulative relative frequencies of the age groups.
Expert Solution & Answer
Want to see the full answer?
Check out a sample textbook solution
Students have asked these similar questions
Please provide the accurate answer to this financial accounting problem using valid techniques.
Please provide the correct answer to this financial accounting problem using valid calculations.
Depreciation A firm is evaluating the acquisition of an asset that costs $68,400 and requires $3,990 in installation costs. If the firm depreciates the
asset under MACRS, using a five-year recovery period (see table |), determine the depreciation charge for each year.
The annual depreciation expense for year 1 will be $
The annual depreciation expense for year 2 will be $
The annual depreciation expense for year 3 will be $
The annual depreciation expense for year 4 will be $
The annual depreciation expense for year 5 will be $
The annual depreciation expense for year 6 will be $
(Round to the nearest dollar.)
(Round to the nearest dollar.)
(Round to the nearest dollar.)
(Round to the nearest dollar.)
(Round to the nearest dollar.)
(Round to the nearest dollar.)
Chapter 4 Solutions
EBK BUSINESS ANALYTICS
Ch. 4 - Prob. 1PECh. 4 - Classify each of the data elements in the Sales...Ch. 4 - Identify each of the variables in the Excel file...Ch. 4 - Classify each of the variables in the Excel file...Ch. 4 - Use the COUNTIF function to construct a frequency...Ch. 4 - A community health status survey obtained the...Ch. 4 - Construct frequency distributions and histograms...Ch. 4 - Use the Histogram tool to develop a frequency...Ch. 4 - Prob. 12PECh. 4 - Use a PivotTable to construct a frequency...
Ch. 4 - Prob. 14PECh. 4 - Find the 20thand80th percentiles of home prices in...Ch. 4 - Find the 10thand90th percentiles and the first and...Ch. 4 - Prob. 18PECh. 4 - Find the first, second, and third quartiles for...Ch. 4 - Prob. 20PECh. 4 - Prob. 21PECh. 4 - Find the mean, median, and midrange for the data...Ch. 4 - In the Excel file Facebook Survey, find the mean,...Ch. 4 - Considering the data in the Excel file Home Market...Ch. 4 - Considering the data in the Excel file Home Market...Ch. 4 - In the Excel file Facebook Survey, find the range,...Ch. 4 - For the Excel file Tablet Computer Sales, find the...Ch. 4 - The Excel file Atlanta Airline Data provides...Ch. 4 - Compute the coefficient of variation for each...Ch. 4 - Find 30 days of stock prices for three companies...Ch. 4 - Apply the Descriptive Statistics tool for subsets...Ch. 4 - Use the Descriptive Statistics tool to summarize...Ch. 4 - Prob. 39PECh. 4 - Prob. 42PECh. 4 - Prob. 43PECh. 4 - Prob. 44PECh. 4 - Prob. 45PECh. 4 - In the Excel file Bicycle Inventory, find the...Ch. 4 - Prob. 48PECh. 4 - Prob. 49PECh. 4 - Prob. 50PECh. 4 - Prob. 51PECh. 4 - Prob. 52PECh. 4 - Prob. 55PECh. 4 - Prob. 56PECh. 4 - Prob. 57PECh. 4 - Prob. 58PECh. 4 - Prob. 59PECh. 4 - In the Excel file Weddings, determine the...Ch. 4 - Prob. 61PECh. 4 - Prob. 62PECh. 4 - For the Presidents Inn Guest Database, find the...Ch. 4 - For the Excel file Credit Risk Data, compute the...Ch. 4 - Compute the z-scores for the data in the Excel...Ch. 4 - Prob. 67PECh. 4 - Prob. 68PECh. 4 - Prob. 70PECh. 4 - Prob. 71PECh. 4 - Prob. 73PECh. 4 - Prob. 74PECh. 4 - Prob. 75PE
Knowledge Booster


Learn more about
Need a deep-dive on the concept behind this application? Look no further. Learn more about this topic, statistics and related others by exploring similar questions and additional content below.Similar questions
- I need help with this financial accounting question using the proper financial approach.arrow_forwardCan you solve this financial accounting problem using appropriate financial principles?arrow_forwardIntegrative Risk and valuation Giant Enterprises' stock has a required return of 15.9%. The company, which plans to pay a dividend of $2.22 per share in the coming year, anticipates that its future dividends will increase at an annual rate consistent with that experienced over 2016-2022 period, when the following dividends were paid: a. If the risk-free rate is 6%, what is the risk premium on Giant's stock? b. Using the constant-growth model, estimate the value of Giant's stock. (Hint: Round the computed dividend growth rate to the nearest whole percent.) c. Explain what effect, if any, a decrease in the risk premium would have on the value of Giant's stock. a. If the risk-free rate is 6%, the risk premium on Giant's stock is %. (Round to one decimal place.) (Round to the nearest cent.) b. Using the constant-growth model, the value of Giant's stock is $ c. Explain what effect, if any, a decrease in the risk premium would have on the value of Giant's stock. (Select from the drop-down…arrow_forward
- Bond valuation-Semiannual interest Find the value of a bond maturing in 4 years, with a $1,000 par value and a coupon interest rate of 9% (4.5% paid semiannually) if the required return on similar-risk bonds is 13% annual interest. The present value of the bond is $ (Round to the nearest cent.)arrow_forwardYield to maturity The relationship between a bond's yield to maturity and coupon interest rate can be used to predict its pricing level. For the bond listed below, state whether the price of the bond will be at a premium to par, at par, or at a discount to par. Coupon interest rate 6% Yield to maturity 11% What is the price of the bond in relation to its par value? (Select the best answer below.) ○ A. The bond sells at a discount to par. B. The bond sells at a premium to par. OC. The bond sells at par.arrow_forwardBook value Find the book value for the asset shown in the accompanying table, assuming that MACRS depreciation is being used Elapsed time Recovery Asset A Installed cost $903,000 period (years) 5 since purchase (years) 4 The remaining book value is $ (Round to the nearest dollar.)arrow_forward
- Common stock value: Constant growth The common stock of Barr Labs Inc., trades for $111 per share. Investors expect the company to pay a(n) $1.43 dividend next year, and they expect that dividend to grow at a constant rate forever. If investors require a(n) 15.5% return on this stock, what is the dividend growth rate that they are anticipating? The anticipated dividend growth rate is %. (Round to two decimal places.)arrow_forwardI need help solving this financial accounting question with the proper methodology.arrow_forwardPlease fill the empty cell in this problem. It is the only thing I need.arrow_forward
- Choosing between two projects with acceptable payback periods Shell Camping Gear, Inc., is considering two mutually exclusive projects. Each requires an initial investment of $100,000. John Shell, president of the company, has set a maximum payback period of 4 years. The cash inflows associated with each project are shown in the following table: a. Determine the payback period of each project. b. Which project is acceptable based on payback period? a. The payback period of project A is years. (Round to two decimal places.) The payback period of project B is years. (Round to two decimal places.) b. Which project is acceptable based on payback period? (Select the best answer below.) ○ Project A would be preferred over project B because the larger cash flows are in the later years of the project. ○ Project B would be preferred over project A because the larger cash flows are in the early years of the project.arrow_forwardWeekend Warriors, Inc., has 35% debt and 65% equity in its capital structure. The firm's estimated after-tax cost of debt is 5% and its estimated cost of equity is 13%. Determine the firm's weighted average cost of capital (WACC). Weekend Warriors' weighted average cost of capital (WACC) is %. (Round to two decimal places.)arrow_forwardInitial cash flow: Basic calculation Cushing Corporation is considering the purchase of a new grading machine to replace the existing one. The existing machine was purchased 4 years ago at an installed cost of $20,700; it was being depreciated under MACRS using a 5-year recovery period. (See table for the applicable depreciation percentages.) The existing machine is expected to have a usable life of at least 5 more years. The new machine costs $36,000 and requires $5,100 in installation costs; it will be depreciated using a 5-year recovery period under MACRS. The existing machine can currently be sold for $24,500 without incurring any removal or cleanup costs. The firm is subject to a 21% tax rate. Calculate the initial cash flow associated with the proposed purchase of a new grading machine. The initial cash flow will be $ (Round to the nearest dollar.)arrow_forward
arrow_back_ios
SEE MORE QUESTIONS
arrow_forward_ios
Recommended textbooks for you
 MarketingMarketingISBN:9780357033791Author:Pride, William MPublisher:South Western Educational Publishing
 Contemporary MarketingMarketingISBN:9780357033777Author:Louis E. Boone, David L. KurtzPublisher:Cengage Learning
Marketing
Marketing
ISBN:9780357033791
Author:Pride, William M
Publisher:South Western Educational Publishing
Contemporary Marketing
Marketing
ISBN:9780357033777
Author:Louis E. Boone, David L. Kurtz
Publisher:Cengage Learning
The Shape of Data: Distributions: Crash Course Statistics #7; Author: CrashCourse;https://www.youtube.com/watch?v=bPFNxD3Yg6U;License: Standard YouTube License, CC-BY
Shape, Center, and Spread - Module 20.2 (Part 1); Author: Mrmathblog;https://www.youtube.com/watch?v=COaid7O_Gag;License: Standard YouTube License, CC-BY
Shape, Center and Spread; Author: Emily Murdock;https://www.youtube.com/watch?v=_YyW0DSCzpM;License: Standard Youtube License