Elementary Statistics (13th Edition)
13th Edition
ISBN: 9780134464244
Author: Triola
Publisher: PEARSON
expand_more
expand_more
format_list_bulleted
Concept explainers
Videos
Textbook Question
Chapter 4, Problem 7CQQ
In Exercises 6–10, use the following results from tests of an experiment to test the effectiveness of an experimental vaccine for children (based on data from USA Today). Express all probabilities in decimal form.
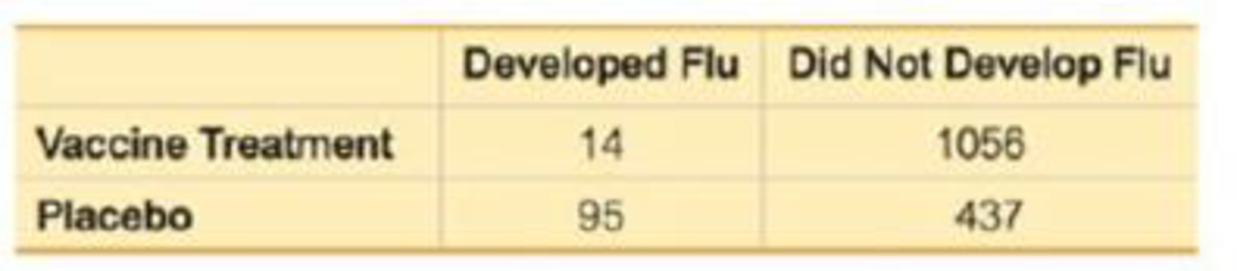
7. If 1 of the 1602 subjects is randomly selected, find the
Expert Solution & Answer
Want to see the full answer?
Check out a sample textbook solution
Students have asked these similar questions
(c) Because logistic regression predicts probabilities of outcomes, observations used to build a logistic regression model need not be independent.
A. false: all observations must be independent
B. true
C. false: only observations with the same outcome need to be independent
I ANSWERED: A. false: all observations must be independent.
(This was marked wrong but I have no idea why. Isn't this a basic assumption of logistic regression)
Business discuss
Spam filters are built on principles similar to those used in logistic regression. We fit a probability that each message is spam or not spam. We have several variables for each email. Here are a few: to_multiple=1 if there are multiple recipients, winner=1 if the word 'winner' appears in the subject line, format=1 if the email is poorly formatted, re_subj=1 if "re" appears in the subject line. A logistic model was fit to a dataset with the following output:
Estimate
SE
Z
Pr(>|Z|)
(Intercept)
-0.8161
0.086
-9.4895
0
to_multiple
-2.5651
0.3052
-8.4047
0
winner
1.5801
0.3156
5.0067
0
format
-0.1528
0.1136
-1.3451
0.1786
re_subj
-2.8401
0.363
-7.824
0
(a) Write down the model using the coefficients from the model fit.log_odds(spam) = -0.8161 + -2.5651 + to_multiple + 1.5801 winner + -0.1528 format + -2.8401 re_subj(b) Suppose we have an observation where to_multiple=0, winner=1, format=0, and re_subj=0. What is the predicted probability that this message is spam?…
Chapter 4 Solutions
Elementary Statistics (13th Edition)
Ch. 4.1 - New Jersey Lottery Let A denote the event of...Ch. 4.1 - Probability Rewrite the following statement so...Ch. 4.1 - Interpreting Weather While this exercise was being...Ch. 4.1 - Subjective Probability Estimate the probability...Ch. 4.1 - Identifying Probability Values Which of the...Ch. 4.1 - Penicillin Who discovered penicillin: Sean Penn,...Ch. 4.1 - Avogadro Constant If you are asked on a quiz to...Ch. 4.1 - Births Example 2 in this section includes the...Ch. 4.1 - In Exercises 9-12, assume that 50 births are...Ch. 4.1 - In Exercises 9-12, assume that 50 births are...
Ch. 4.1 - In Exercises 9-12, assume that 50 births are...Ch. 4.1 - In Exercises 9-12, assume that 50 births are...Ch. 4.1 - In Exercises 13-20, express the indicated degree...Ch. 4.1 - SAT Test When making a random guess for an answer...Ch. 4.1 - In Exercises 13-20, express the indicated degree...Ch. 4.1 - In Exercises 13-20, express the indicated degree...Ch. 4.1 - Randomness When using a computer to randomly...Ch. 4.1 - In Exercises 13-20, express the indicated degree...Ch. 4.1 - In Exercises 13-20, express the indicated degree...Ch. 4.1 - In Exercises 13-20, express the indicated degree...Ch. 4.1 - In Exercises 21-24, refer to the sample data in...Ch. 4.1 - In Exercises 21-24, refer to the sample data in...Ch. 4.1 - In Exercises 21-24, refer to the sample data in...Ch. 4.1 - In Exercises 21-24, refer to the sample data in...Ch. 4.1 - In Exercises 25-32, find the probability and...Ch. 4.1 - In Exercises 25-32, find the probability and...Ch. 4.1 - In Exercises 25-32, find the probability and...Ch. 4.1 - In Exercises 25-32, find the probability and...Ch. 4.1 - In Exercises 25-32, find the probability and...Ch. 4.1 - In Exercises 25-32, find the probability and...Ch. 4.1 - In Exercises 25-32, find the probability and...Ch. 4.1 - In Exercises 25-32, find the probability and...Ch. 4.1 - Probability from a Sample Space. In Exercises...Ch. 4.1 - Probability from a Sample Space. In Exercises...Ch. 4.1 - Probability from a Sample Space. In Exercises...Ch. 4.1 - Probability from a Sample Space. In Exercises...Ch. 4.1 - Using Probability to Form Conclusions. In...Ch. 4.1 - Using Probability to Form Conclusions. In...Ch. 4.1 - Using Probability to Form Conclusions. In...Ch. 4.1 - Using Probability to Form Conclusions. In...Ch. 4.1 - Kentucky Pick 4 In the Kentucky Pick 4 lottery,...Ch. 4.1 - Finding Odds in Roulette A roulette wheel has 38...Ch. 4.1 - Kentucky Derby Odds When the horse California...Ch. 4.1 - Relative Risk and Odds Ratio In a clinical trial...Ch. 4.2 - Notation When randomly selecting an adult, A...Ch. 4.2 - Notation When randomly selecting adults, let M...Ch. 4.2 - Sample for a Poll There are 15,524,971 adults in...Ch. 4.2 - Rule of Complements When randomly selecting an...Ch. 4.2 - Finding Complements. In Exercises 5-8, find the...Ch. 4.2 - Finding Complements. In Exercises 5-8, find the...Ch. 4.2 - Finding Complements. In Exercises 5-8, find the...Ch. 4.2 - Finding Complements. In Exercises 5-8, find the...Ch. 4.2 - In Exercises 9-20, use the data in the following...Ch. 4.2 - In Exercises 9-20, use the data in the following...Ch. 4.2 - In Exercises 9-20, use the data in the following...Ch. 4.2 - In Exercises 9-20, use the data in the following...Ch. 4.2 - In Exercises 9-20; use the data in the following...Ch. 4.2 - In Exercises 9-20, use the data in the following...Ch. 4.2 - In Exercises 9-20, use the data in the following...Ch. 4.2 - In Exercises 9-20, use the data in the following...Ch. 4.2 - In Exercises 9-20, use the data in the following...Ch. 4.2 - In Exercises 9-20, use the data in the following...Ch. 4.2 - In Exercises 9-20, use the data in the following...Ch. 4.2 - In Exercises 9-20, use the data in the following...Ch. 4.2 - In Exercises 21-24, use these results from the...Ch. 4.2 - In Exercises 21-24, use these results from the...Ch. 4.2 - In Exercises 21-24, use these results from the...Ch. 4.2 - In Exercises 21-24, use these results from the...Ch. 4.2 - Redundancy. Exercises 25 and 26 involve...Ch. 4.2 - Redundancy. Exercises 25 and 26 involve...Ch. 4.2 - Acceptance Sampling. With one method of a...Ch. 4.2 - Acceptance Sampling. With one method of a...Ch. 4.2 - In Exercises 29 and 30, find the probabilities and...Ch. 4.2 - Prob. 30BSCCh. 4.2 - Surge Protectors Refer to the accompanying figure...Ch. 4.2 - Prob. 32BBCh. 4.2 - Exclusive Or The exclusive or means either one or...Ch. 4.2 - Complements and the Addition Rule Refer to the...Ch. 4.3 - Language: Complement of At Least One Let A = the...Ch. 4.3 - Probability of At Least One Let A = the event of...Ch. 4.3 - Notation When selecting one of your Facebook...Ch. 4.3 - Notation When selecting one of your Facebook...Ch. 4.3 - At Least One. In Exercises 5-12, find the...Ch. 4.3 - Probability of a Girl Assuming that boys and girls...Ch. 4.3 - At Least One. In Exercises 5-12, find the...Ch. 4.3 - At Least One. In Exercises 5-12, find the...Ch. 4.3 - At Least One. In Exercises 5-12, find the...Ch. 4.3 - At Least One. In Exercises 5-12, find the...Ch. 4.3 - At Least One. In Exercises 5-12, find the...Ch. 4.3 - At Least One. In Exercises 5-12, find the...Ch. 4.3 - Denomination Effect. In Exercises 13-16, use the...Ch. 4.3 - Denomination Effect. In Exercises 13-16, use the...Ch. 4.3 - Denomination Effect. In Exercises 13-16, use the...Ch. 4.3 - Denomination Effect. In Exercises 13-16, use the...Ch. 4.3 - In Exercises 17-20, refer to the accompanying...Ch. 4.3 - In Exercises 17-20, refer to the accompanying...Ch. 4.3 - In Exercises 17-20, refer to the accompanying...Ch. 4.3 - In Exercises 17-20, refer to the accompanying...Ch. 4.3 - Redundancy in Computer Hard Drives Assume that...Ch. 4.3 - Redundancy in Stadium Generators Large stadiums...Ch. 4.3 - Composite Drug Test Based on the data in Table 4-1...Ch. 4.3 - Composite Water Samples The Fairfield County...Ch. 4.3 - Shared Birthdays Find the probability that of 25...Ch. 4.4 - Notation What does the symbol ! represent? Six...Ch. 4.4 - New Jersey Pick 6 In the New Jersey Pick 6 lottery...Ch. 4.4 - Oregon Pick 4 In the Oregon Pick 4 lottery game, a...Ch. 4.4 - Combination Lock The typical combination lock uses...Ch. 4.4 - In Exercises 536, express all probabilities as...Ch. 4.4 - Social Security Numbers A Social Security number...Ch. 4.4 - Quinela In a horse race, a quinela bet is won if...Ch. 4.4 - Soccer Shootout In soccer, a tie at the end of...Ch. 4.4 - Grading Exams Your professor has just collected...Ch. 4.4 - Radio Station Call Letters If radio station call...Ch. 4.4 - Scheduling Routes A presidential candidate plans...Ch. 4.4 - Survey Reliability A survey with 12 questions is...Ch. 4.4 - Safety with Numbers The author owns a safe in...Ch. 4.4 - Electricity When testing for current in a cable...Ch. 4.4 - Sorting Hat At Hogwarts School of Witchcraft and...Ch. 4.4 - Moving Company The United Van Lines moving company...Ch. 4.4 - Powerball As of this writing, the Powerball...Ch. 4.4 - Teed Off When four golfers are about to begin a...Ch. 4.4 - ZIP Code If you randomly select five digits, each...Ch. 4.4 - FedEx Deliveries With a short time remaining in...Ch. 4.4 - Phone Numbers Current rules for telephone area...Ch. 4.4 - Classic Counting Problem A classic counting...Ch. 4.4 - Corporate Officers and Committees The Digital Pet...Ch. 4.4 - ATM You want to obtain cash by using an ATM, but...Ch. 4.4 - Party Mix DJ Marty T is hosting a party tonight...Ch. 4.4 - Identity Theft with Credit Cards Credit card...Ch. 4.4 - What a Word! One of the longest words in standard...Ch. 4.4 - Phase I of a Clinical Trial A clinical test on...Ch. 4.4 - Mega Millions As of this writing, the Mega...Ch. 4.4 - Designing Experiment Clinical trials of Nasonex...Ch. 4.4 - Morse Codes The International Morse code is a way...Ch. 4.4 - Mendels Peas Mendel conducted some his famous...Ch. 4.4 - Change for a Quarter How many different ways can...Ch. 4.4 - Counting with Fingers How many different ways can...Ch. 4.4 - Change for a Quarter How many different ways can...Ch. 4.4 - Win 1 Billion Quicken Loans offered a prize of 1...Ch. 4.4 - Computer Variable Names A common computer...Ch. 4.4 - High Fives a. Five mathletes celebrate after...Ch. 4 - Standard Tests Standard tests, such as the SAT or...Ch. 4 - Rain As the author is creating this exercise, a...Ch. 4 - Months If a month is randomly selected after...Ch. 4 - Social Networking Based on data from the Pew...Ch. 4 - Subjective Probability Estimate the probability...Ch. 4 - In Exercises 610, use the following results from...Ch. 4 - In Exercises 610, use the following results from...Ch. 4 - In Exercises 610, use the following results from...Ch. 4 - In Exercises 610, use the following results from...Ch. 4 - In Exercises 610, use the following results from...Ch. 4 - In Exercises 110, use the data in the accompanying...Ch. 4 - In Exercises 110, use the data in the accompanying...Ch. 4 - In Exercises 110, use the data in the accompanying...Ch. 4 - In Exercises 110, use the data in the accompanying...Ch. 4 - In Exercises 110, use the data in the accompanying...Ch. 4 - Prob. 6RECh. 4 - Prob. 7RECh. 4 - In Exercises 110, use the data in the accompanying...Ch. 4 - In Exercises 110, use the data in the accompanying...Ch. 4 - Prob. 10RECh. 4 - Black Cars Use subjective probability to estimate...Ch. 4 - Vision Correction About 75% of the U.S. population...Ch. 4 - National Statistics Day a. If a person is randomly...Ch. 4 - Composite Sampling for Diabetes Currently, the...Ch. 4 - Wild Card Lottery The Wild Card lottery is run in...Ch. 4 - Pennsylvania Cash 5 In the Pennsylvania Cash 5...Ch. 4 - Redundancy Using Braun battery-powered alarm...Ch. 4 - Exacta In a horse race, an exacta bet is won by...Ch. 4 - Fatal Drunk Driving Listed below are the blood...Ch. 4 - Fatal Drunk Driving Use the same data given in...Ch. 4 - Organ Donors USA Today provided information about...Ch. 4 - Sampling Eye Color Based on a study by Dr. P....Ch. 4 - Prob. 5CRECh. 4 - New Lottery Game In the Monopoly Millionaires Club...Ch. 4 - Critical Thinking: Interpreting results from a...Ch. 4 - Critical Thinking: Interpreting results from a...Ch. 4 - Critical Thinking: Interpreting results from a...Ch. 4 - Critical Thinking: Interpreting results from a...Ch. 4 - Critical Thinking: Interpreting results from a...Ch. 4 - Critical Thinking: Interpreting results from a...Ch. 4 - Critical Thinking: Interpreting results from a...Ch. 4 - Critical Thinking: Interpreting results from a...Ch. 4 - Critical Thinking: Interpreting results from a...
Knowledge Booster


Learn more about
Need a deep-dive on the concept behind this application? Look no further. Learn more about this topic, statistics and related others by exploring similar questions and additional content below.Similar questions
- Consider an event X comprised of three outcomes whose probabilities are 9/18, 1/18,and 6/18. Compute the probability of the complement of the event. Question content area bottom Part 1 A.1/2 B.2/18 C.16/18 D.16/3arrow_forwardJohn and Mike were offered mints. What is the probability that at least John or Mike would respond favorably? (Hint: Use the classical definition.) Question content area bottom Part 1 A.1/2 B.3/4 C.1/8 D.3/8arrow_forwardThe details of the clock sales at a supermarket for the past 6 weeks are shown in the table below. The time series appears to be relatively stable, without trend, seasonal, or cyclical effects. The simple moving average value of k is set at 2. What is the simple moving average root mean square error? Round to two decimal places. Week Units sold 1 88 2 44 3 54 4 65 5 72 6 85 Question content area bottom Part 1 A. 207.13 B. 20.12 C. 14.39 D. 0.21arrow_forward
- The details of the clock sales at a supermarket for the past 6 weeks are shown in the table below. The time series appears to be relatively stable, without trend, seasonal, or cyclical effects. The simple moving average value of k is set at 2. If the smoothing constant is assumed to be 0.7, and setting F1 and F2=A1, what is the exponential smoothing sales forecast for week 7? Round to the nearest whole number. Week Units sold 1 88 2 44 3 54 4 65 5 72 6 85 Question content area bottom Part 1 A. 80 clocks B. 60 clocks C. 70 clocks D. 50 clocksarrow_forwardThe details of the clock sales at a supermarket for the past 6 weeks are shown in the table below. The time series appears to be relatively stable, without trend, seasonal, or cyclical effects. The simple moving average value of k is set at 2. Calculate the value of the simple moving average mean absolute percentage error. Round to two decimal places. Week Units sold 1 88 2 44 3 54 4 65 5 72 6 85 Part 1 A. 14.39 B. 25.56 C. 23.45 D. 20.90arrow_forwardThe accompanying data shows the fossil fuels production, fossil fuels consumption, and total energy consumption in quadrillions of BTUs of a certain region for the years 1986 to 2015. Complete parts a and b. Year Fossil Fuels Production Fossil Fuels Consumption Total Energy Consumption1949 28.748 29.002 31.9821950 32.563 31.632 34.6161951 35.792 34.008 36.9741952 34.977 33.800 36.7481953 35.349 34.826 37.6641954 33.764 33.877 36.6391955 37.364 37.410 40.2081956 39.771 38.888 41.7541957 40.133 38.926 41.7871958 37.216 38.717 41.6451959 39.045 40.550 43.4661960 39.869 42.137 45.0861961 40.307 42.758 45.7381962 41.732 44.681 47.8261963 44.037 46.509 49.6441964 45.789 48.543 51.8151965 47.235 50.577 54.0151966 50.035 53.514 57.0141967 52.597 55.127 58.9051968 54.306 58.502 62.4151969 56.286…arrow_forward
- The accompanying data shows the fossil fuels production, fossil fuels consumption, and total energy consumption in quadrillions of BTUs of a certain region for the years 1986 to 2015. Complete parts a and b. Year Fossil Fuels Production Fossil Fuels Consumption Total Energy Consumption1949 28.748 29.002 31.9821950 32.563 31.632 34.6161951 35.792 34.008 36.9741952 34.977 33.800 36.7481953 35.349 34.826 37.6641954 33.764 33.877 36.6391955 37.364 37.410 40.2081956 39.771 38.888 41.7541957 40.133 38.926 41.7871958 37.216 38.717 41.6451959 39.045 40.550 43.4661960 39.869 42.137 45.0861961 40.307 42.758 45.7381962 41.732 44.681 47.8261963 44.037 46.509 49.6441964 45.789 48.543 51.8151965 47.235 50.577 54.0151966 50.035 53.514 57.0141967 52.597 55.127 58.9051968 54.306 58.502 62.4151969 56.286…arrow_forwardThe accompanying data shows the fossil fuels production, fossil fuels consumption, and total energy consumption in quadrillions of BTUs of a certain region for the years 1986 to 2015. Complete parts a and b. Develop line charts for each variable and identify the characteristics of the time series (that is, random, stationary, trend, seasonal, or cyclical). What is the line chart for the variable Fossil Fuels Production?arrow_forwardThe accompanying data shows the fossil fuels production, fossil fuels consumption, and total energy consumption in quadrillions of BTUs of a certain region for the years 1986 to 2015. Complete parts a and b. Year Fossil Fuels Production Fossil Fuels Consumption Total Energy Consumption1949 28.748 29.002 31.9821950 32.563 31.632 34.6161951 35.792 34.008 36.9741952 34.977 33.800 36.7481953 35.349 34.826 37.6641954 33.764 33.877 36.6391955 37.364 37.410 40.2081956 39.771 38.888 41.7541957 40.133 38.926 41.7871958 37.216 38.717 41.6451959 39.045 40.550 43.4661960 39.869 42.137 45.0861961 40.307 42.758 45.7381962 41.732 44.681 47.8261963 44.037 46.509 49.6441964 45.789 48.543 51.8151965 47.235 50.577 54.0151966 50.035 53.514 57.0141967 52.597 55.127 58.9051968 54.306 58.502 62.4151969 56.286…arrow_forward
- For each of the time series, construct a line chart of the data and identify the characteristics of the time series (that is, random, stationary, trend, seasonal, or cyclical). Month PercentApr 1972 4.97May 1972 5.00Jun 1972 5.04Jul 1972 5.25Aug 1972 5.27Sep 1972 5.50Oct 1972 5.73Nov 1972 5.75Dec 1972 5.79Jan 1973 6.00Feb 1973 6.02Mar 1973 6.30Apr 1973 6.61May 1973 7.01Jun 1973 7.49Jul 1973 8.30Aug 1973 9.23Sep 1973 9.86Oct 1973 9.94Nov 1973 9.75Dec 1973 9.75Jan 1974 9.73Feb 1974 9.21Mar 1974 8.85Apr 1974 10.02May 1974 11.25Jun 1974 11.54Jul 1974 11.97Aug 1974 12.00Sep 1974 12.00Oct 1974 11.68Nov 1974 10.83Dec 1974 10.50Jan 1975 10.05Feb 1975 8.96Mar 1975 7.93Apr 1975 7.50May 1975 7.40Jun 1975 7.07Jul 1975 7.15Aug 1975 7.66Sep 1975 7.88Oct 1975 7.96Nov 1975 7.53Dec 1975 7.26Jan 1976 7.00Feb 1976 6.75Mar 1976 6.75Apr 1976 6.75May 1976…arrow_forwardHi, I need to make sure I have drafted a thorough analysis, so please answer the following questions. Based on the data in the attached image, develop a regression model to forecast the average sales of football magazines for each of the seven home games in the upcoming season (Year 10). That is, you should construct a single regression model and use it to estimate the average demand for the seven home games in Year 10. In addition to the variables provided, you may create new variables based on these variables or based on observations of your analysis. Be sure to provide a thorough analysis of your final model (residual diagnostics) and provide assessments of its accuracy. What insights are available based on your regression model?arrow_forwardI want to make sure that I included all possible variables and observations. There is a considerable amount of data in the images below, but not all of it may be useful for your purposes. Are there variables contained in the file that you would exclude from a forecast model to determine football magazine sales in Year 10? If so, why? Are there particular observations of football magazine sales from previous years that you would exclude from your forecasting model? If so, why?arrow_forward
arrow_back_ios
SEE MORE QUESTIONS
arrow_forward_ios
Recommended textbooks for you
 Holt Mcdougal Larson Pre-algebra: Student Edition...AlgebraISBN:9780547587776Author:HOLT MCDOUGALPublisher:HOLT MCDOUGAL
 College Algebra (MindTap Course List)AlgebraISBN:9781305652231Author:R. David Gustafson, Jeff HughesPublisher:Cengage Learning
Holt Mcdougal Larson Pre-algebra: Student Edition...
Algebra
ISBN:9780547587776
Author:HOLT MCDOUGAL
Publisher:HOLT MCDOUGAL
College Algebra (MindTap Course List)
Algebra
ISBN:9781305652231
Author:R. David Gustafson, Jeff Hughes
Publisher:Cengage Learning
Probability & Statistics (28 of 62) Basic Definitions and Symbols Summarized; Author: Michel van Biezen;https://www.youtube.com/watch?v=21V9WBJLAL8;License: Standard YouTube License, CC-BY
Introduction to Probability, Basic Overview - Sample Space, & Tree Diagrams; Author: The Organic Chemistry Tutor;https://www.youtube.com/watch?v=SkidyDQuupA;License: Standard YouTube License, CC-BY