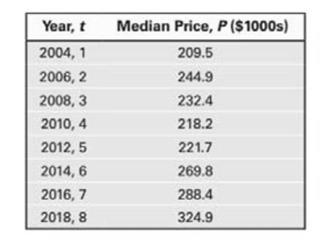
Housing Prices The data in the table on the right represents the January median new-home prices in the United states for the years shown. ( a ) With a graphing utility, draw a scatter plot of the data. Comment on the type of relation that appears to exist between the two variables. ( b ) Decide on the function of best fit to these data ( linear, quadratic, or cubic ) , and use this function to predict the median new-phone price in the United States for January 2022 ( t = 10 ) . ( c ) Draw the function of best fit on the scatter plot obtained in part ( a ) .
Housing Prices The data in the table on the right represents the January median new-home prices in the United states for the years shown. ( a ) With a graphing utility, draw a scatter plot of the data. Comment on the type of relation that appears to exist between the two variables. ( b ) Decide on the function of best fit to these data ( linear, quadratic, or cubic ) , and use this function to predict the median new-phone price in the United States for January 2022 ( t = 10 ) . ( c ) Draw the function of best fit on the scatter plot obtained in part ( a ) .
Solution Summary: The author explains how to sketch the graph using graphing calculator using the steps below.
Housing Prices The data in the table on the right represents the January median new-home prices in the United states for the years shown.
(
a
)
With a graphing utility, draw a scatter plot of the data. Comment on the type of relation that appears to exist between the two variables.
(
b
)
Decide on the function of best fit to these data
(
linear, quadratic, or cubic
)
, and use this function to predict the median new-phone price in the United States for January
2022
(
t
=
10
)
.
(
c
)
Draw the function of best fit on the scatter plot obtained in part
(
a
)
.
Definition Definition Representation of the direction and degree of correlation in graphical form. The grouping of points that are plotted makes it a scatter diagram. A line can be drawn showing the relationship based on the direction of points and their distance from each other.
Can you answer this question and give step by step and why and how to get it. Can you write it (numerical method)
Can you answer this question and give step by step and why and how to get it. Can you write it (numerical method)
There are three options for investing $1150. The first earns 10% compounded annually, the second earns 10% compounded quarterly, and the third earns 10% compounded continuously. Find equations that model each investment growth and
use a graphing utility to graph each model in the same viewing window over a 20-year period. Use the graph to determine which investment yields the highest return after 20 years. What are the differences in earnings among the three
investment?
STEP 1: The formula for compound interest is
A =
nt
= P(1 + − − ) n²,
where n is the number of compoundings per year, t is the number of years, r is the interest rate, P is the principal, and A is the amount (balance) after t years. For continuous compounding, the formula reduces to
A = Pert
Find r and n for each model, and use these values to write A in terms of t for each case.
Annual Model
r=0.10
A = Y(t) = 1150 (1.10)*
n = 1
Quarterly Model
r = 0.10
n = 4
A = Q(t) = 1150(1.025) 4t
Continuous Model
r=0.10
A = C(t) =…
Chapter 4 Solutions
Mylab Math With Pearson Etext -- Standalone Access Card -- For Precalculus (11th Edition)
Need a deep-dive on the concept behind this application? Look no further. Learn more about this topic, calculus and related others by exploring similar questions and additional content below.


 Glencoe Algebra 1, Student Edition, 9780079039897...AlgebraISBN:9780079039897Author:CarterPublisher:McGraw Hill
 Holt Mcdougal Larson Pre-algebra: Student Edition...AlgebraISBN:9780547587776Author:HOLT MCDOUGALPublisher:HOLT MCDOUGAL
 Big Ideas Math A Bridge To Success Algebra 1: Stu...AlgebraISBN:9781680331141Author:HOUGHTON MIFFLIN HARCOURTPublisher:Houghton Mifflin Harcourt
 College AlgebraAlgebraISBN:9781305115545Author:James Stewart, Lothar Redlin, Saleem WatsonPublisher:Cengage Learning
 Functions and Change: A Modeling Approach to Coll...AlgebraISBN:9781337111348Author:Bruce Crauder, Benny Evans, Alan NoellPublisher:Cengage Learning