
Concept explainers
Videos
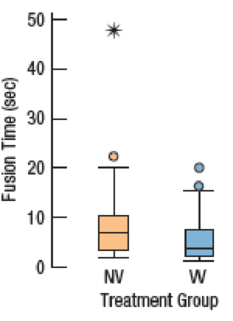
Stereograms Stereograms appear to be composed entirely of random dots. However, they contain separate images that a viewer can “fuse” into a three-dimensional (3D) image by staring at the dots while defocusing the eyes. An experiment was performed to determine whether knowledge of the embedded image affected the time required for subjects to fuse the images.
One group of subjects (group NV) received no information or just verbal information about the shape of the embedded object. A second group (group VV) received both verbal information and visual information (specifically, a drawing of the object). The experimenters measured how many seconds it took for the subject to report that he or she saw the 3D image.
- a) What two variables are discussed in this description?
- b) For each variable, is it quantitative or categorical? If quantitative, what are the units?
- c) The boxplots compare the fusion times for the two treatment groups. Write a few sentences comparing these distributions. What does the experiment show?
Want to see the full answer?
Check out a sample textbook solution
Chapter 4 Solutions
Intro STATS, Books a la Carte Plus New Mystatlab with Pearson Etext -- Access Card Package
Additional Math Textbook Solutions
Math in Our World
Precalculus: Mathematics for Calculus (Standalone Book)
Precalculus: A Unit Circle Approach (3rd Edition)
Precalculus
University Calculus: Early Transcendentals (4th Edition)
Mathematics for the Trades: A Guided Approach (11th Edition) (What's New in Trade Math)


- Show all workarrow_forwardplease find the answers for the yellows boxes using the information and the picture belowarrow_forwardA marketing agency wants to determine whether different advertising platforms generate significantly different levels of customer engagement. The agency measures the average number of daily clicks on ads for three platforms: Social Media, Search Engines, and Email Campaigns. The agency collects data on daily clicks for each platform over a 10-day period and wants to test whether there is a statistically significant difference in the mean number of daily clicks among these platforms. Conduct ANOVA test. You can provide your answer by inserting a text box and the answer must include: also please provide a step by on getting the answers in excel Null hypothesis, Alternative hypothesis, Show answer (output table/summary table), and Conclusion based on the P value.arrow_forward
- A company found that the daily sales revenue of its flagship product follows a normal distribution with a mean of $4500 and a standard deviation of $450. The company defines a "high-sales day" that is, any day with sales exceeding $4800. please provide a step by step on how to get the answers Q: What percentage of days can the company expect to have "high-sales days" or sales greater than $4800? Q: What is the sales revenue threshold for the bottom 10% of days? (please note that 10% refers to the probability/area under bell curve towards the lower tail of bell curve) Provide answers in the yellow cellsarrow_forwardBusiness Discussarrow_forwardThe following data represent total ventilation measured in liters of air per minute per square meter of body area for two independent (and randomly chosen) samples. Analyze these data using the appropriate non-parametric hypothesis testarrow_forward
 Big Ideas Math A Bridge To Success Algebra 1: Stu...AlgebraISBN:9781680331141Author:HOUGHTON MIFFLIN HARCOURTPublisher:Houghton Mifflin Harcourt
 Glencoe Algebra 1, Student Edition, 9780079039897...AlgebraISBN:9780079039897Author:CarterPublisher:McGraw Hill