
Concept explainers
The sketch of the graph for the given function and to explain the trends in the graph.
Answer to Problem 4.1P
The graph for the function
Explanation of Solution
Given:
The Planck distribution function for blackbody
Calculation:
Consider the term,
The value of the term is calculated as,
Consider the term,
The value of the term is calculated as,
Thus, the Planck's distribution function of a blackbody radiation for a fixed temperature
The following table shows the Planck's intensity distribution for different wavelengths at a fixed temperature.
| Wavelength | |
The following figure shows the Planck's intensity distribution for different wavelengths at a fixed temperature.
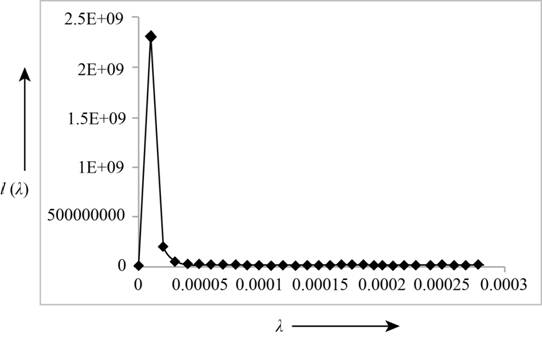
Figure (1)
From the graph, it can be concluded that the intensity of blackbody radiation for a fixed temperature, is maximum at a particular wavelength and it becomes zero with the increase in wavelength. With the increase in temperature, the maximum intensity of a radiation shift towards the shorter wavelengths.
Conclusion:
Therefore, the graph for the function
Want to see more full solutions like this?
Chapter 4 Solutions
Modern Physics For Scientists And Engineers


- The angle between the axes of two polarizing filters is 19.0°. By how much does the second filter reduce the intensity of the light coming through the first? I = 0.106 40 xarrow_forwardAn oil slick on water is 82.3 nm thick and illuminated by white light incident perpendicular to its surface. What color does the oil appear (what is the most constructively reflected wavelength, in nanometers), given its index of refraction is 1.43? (Assume the index of refraction of water is 1.33.) wavelength color 675 × nm red (1 660 nm)arrow_forwardA 1.50 μF capacitor is charging through a 16.0 Ω resistor using a 15.0 V battery. What will be the current when the capacitor has acquired 1/4 of its maximum charge? Please explain all stepsarrow_forward
- In the circuit shown in the figure (Figure 1), the 6.0 Ω resistor is consuming energy at a rate of 24 J/s when the current through it flows as shown. What are the polarity and emf of the battery E, assuming it has negligible internal resistance? Please explain all steps. I know you need to use the loop rule, but I keep getting the answer wrong.arrow_forwardIf you connect a 1.8 F and a 2.6 F capacitor in series, what will be the equivalent capacitance?arrow_forwardSuppose that a particular heart defibrillator uses a 1.5 x 10⁻⁵ Farad capacitor. If it is charged up to a voltage of 7300 volts, how much energy is stored in the capacitor? Give your answer as the number of Joules.arrow_forward
- The voltage difference across an 8.3 nanometer thick cell membrane is 6.5 x 10⁻⁵volts. What is the magnitude of the electric field inside this cell membrane? (Assume the field is uniform, and give your answer as the number of Volts per meter... which is the same as the number of Newtons per Coulomb.)arrow_forwardThree identical capacitors are connected in parallel. When this parallel assembly of capacitors is connected to a 12 volt battery, a total of 3.1 x 10⁻⁵ coulombs flows through the battery. What is the capacitance of one individual capacitor? (Give your answer as the number of Farads.)arrow_forwardSuppose you construct your own capacitor by placing two parallel plates at a distance 0.27 meters apart. The plates each have a surface area of 0.64 square meters. What is the capacitance of this setup? (Give your answer as the number of Farads.)arrow_forward
- Draw a diagram with the new arrows. No they do not point all towards the center.arrow_forwardExample In Canada, the Earth has B = 0.5 mŢ, pointing north, 70.0° below the horizontal. a) Find the magnetic force on an oxygen ion (O2) moving due east at 250 m/s b) Compare the |FB| to |FE| due to Earth's fair- weather electric field (150 V/m downward).arrow_forwardFour charges, qa, qb, qa, and qd are fixed at the corners of a square. A charge q that is free to move located at the exact center of the square. Classify the scenarios described according to the force that would be exerted on the center charge q. Assume in each case that q is a positive charge. Do not assume that the fixed charges have equal magnitudes unless the scenario defines such an equality. qa Яс q %b Force is zero Force is to the left Force is to the right Force is undeterminedarrow_forward
 College PhysicsPhysicsISBN:9781285737027Author:Raymond A. Serway, Chris VuillePublisher:Cengage Learning
 Physics for Scientists and Engineers with Modern ...PhysicsISBN:9781337553292Author:Raymond A. Serway, John W. JewettPublisher:Cengage Learning
 Principles of Physics: A Calculus-Based TextPhysicsISBN:9781133104261Author:Raymond A. Serway, John W. JewettPublisher:Cengage Learning
 University Physics Volume 3PhysicsISBN:9781938168185Author:William Moebs, Jeff SannyPublisher:OpenStax
 College PhysicsPhysicsISBN:9781938168000Author:Paul Peter Urone, Roger HinrichsPublisher:OpenStax College
 Modern PhysicsPhysicsISBN:9781111794378Author:Raymond A. Serway, Clement J. Moses, Curt A. MoyerPublisher:Cengage Learning