
Subpart (a)
Calculate and illustrate the
Subpart (a)
Explanation of Solution
Given information:
The equilibrium for market of DVD s is attained when
The consumer surplus when the
Thus, the consumer surplus is $18.
The producer surplus when the equilibrium price is P and Quantity is Q is calculated using equation (2),
Thus, the producer surplus is $18.
Figure 1 illustrates the consumer surplus and producer surplus.
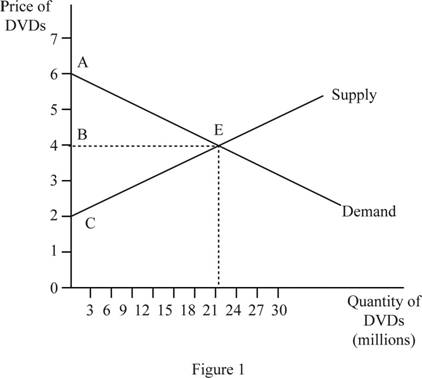
The figure 1 shows the equilibrium where the quantity of DVDs is plotted along the horizontal axis and the price of DVDs is plotted along the vertical axis. The consumer surplus is obtained by the area of the triangle ABE and the producer surplus is obtained by the area of triangle CBE.
Consumer Surplus: The consumer surplus is defined as the difference between the maximum amount a person is willing to pay for consuming a commodity and the actual price he pay for it.
Producer Surplus: The producer surplus is defined as the difference between the actual market price for which a commodity is sold and the minimum cost at which the producer is willing to sell the commodity. This minimum accepted price is usually the cost of production of the commodity.
Subpart (b)
To calculate the total consumer surplus, producer surplus and dead weight loss when there is underproduction and show them on the graph.
Subpart (b)
Explanation of Solution
Given information:
The equilibrium for market of DVD s is attained when price is $4 and quantity is 18 million. The underproduction leads to production of 9 million DVDs.
When the production reduces to 9 million, the consumer surplus is calculated as follows.
Thus, the consumer surplus at underproduction of 9 million DVD s is $13.5 million.
When the production reduces to 9 million, the producer surplus is calculated as,
Thus, the producer surplus at underproduction of 9 million DVDs is $13.5 million.
The
Thus, the deadweight loss of underproduction is $9 million.
Figure 2 illustrates the deadweight loss.
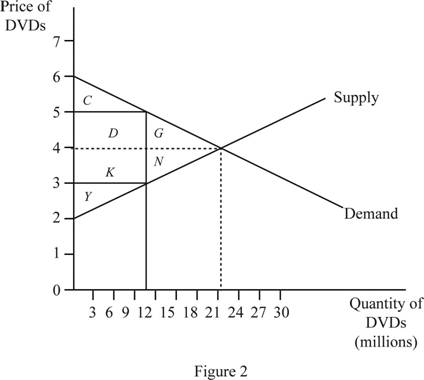
The figure 2 shows the market for DVD s with underproduction. The horizontal axis measures the quantity of DVDs and the vertical axis measures the price of DVDs. The underproduction results in a deadweight loss which is shown by the area of G and N.
Consumer Surplus: The consumer surplus is defined as the difference between the maximum amount a person is willing to pay for consuming a commodity and the actual price he pay for it.
Producer Surplus: The producer surplus is defined as the difference between the actual market price for which a commodity is sold and the minimum cost at which the producer is willing to sell the commodity. This minimum accepted price is usually the cost of production of the commodity.
Deadweight loss: Deadweight loss is defined as the loss of the total consumer surplus and producer surplus due to overproduction or underproduction.
Subpart (c)
To calculate the total consumer surplus, producer surplus and dead weight loss when there is overproduction and show them on the graph.
Subpart (c)
Explanation of Solution
Given information:
The equilibrium for market of DVD s is attained when price is $4 and quantity is 18 million. The overproduction leads to production of 27 million DVDs.
When there is overproduction, the consumer surplus is calculated as the same as consumer surplus at equilibrium.
Thus, the consumer surplus is $18.
The producer surplus of overproduction is same as the equilibrium producer surplus and is calculated using equation (2),
Thus, the producer surplus is $18.
The deadweight loss of over production is equal to the area of triangle EFG. It can be calculated as follows,
Thus, the deadweight loss of overproduction is $9 million.
Figure 3 illustrates the deadweight loss.
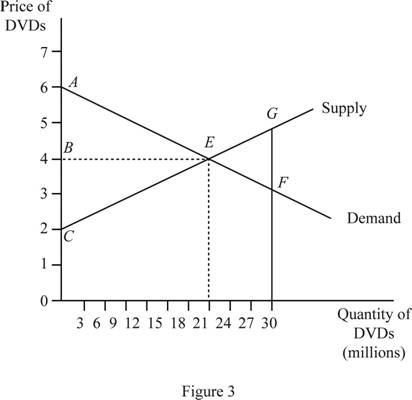
The figure 3 shows the equilibrium where the quantity of DVDs is plotted along the horizontal axis and the price of DVDs is plotted along the vertical axis. The consumer surplus is obtained by the area of the triangle ABE and the producer surplus is obtained by the area of triangle CBE. Due to overproduction there is a deadweight loss which is equal to the area of the triangle EFG.
Consumer Surplus: The consumer surplus is defined as the difference between the maximum amount a person is willing to pay for consuming a commodity and the actual price he pay for it.
Producer Surplus: The producer surplus is defined as the difference between the actual market price for which a commodity is sold and the minimum cost at which the producer is willing to sell the commodity. This minimum accepted price is usually the cost of production of the commodity.
Deadweight loss: Deadweight loss is defined as the loss of the total consumer surplus and producer surplus due to overproduction or underproduction.
Want to see more full solutions like this?
Chapter 4 Solutions
Pearson eText for Principles of Macroeconomics -- Combo Access Card

- What are the consequences of declining houses prices?arrow_forwardQ1 Explain what economic catch 22 is. Q2 What are the consequences of declining houses pricing? Q3 What is the argument about necessary evil? Q4 Explain the idea of irrational exhuberance? Q5 Explain what was the economic paradox?arrow_forward< Files 9:10 Fri Mar 21 Chapter+11-Public+Goods+and+Common+Res... The Economic Catch-22 By Robert J. Samuelson We are now in the "blame phase" of the economic cycle. As the housing slump deepens and financial markets swing erratically, we've embarked on the usual search for culprits. Who got us into this mess? Our investigations will doubtlessly reveal, as they already have, much wishful thinking and miscalculation. They will also find incompetence, predatory behavior and probably some criminality. But let me suggest that, though inevitable and necessary, this exercise is also simplistic and deceptive. -- business It assumes that, absent mistakes and misdeeds, we might remain in a permanent paradise of powerful income and wealth growth. The reality, I think, is that the economy follows its own Catch-22: By taking prosperity for granted, people perversely subvert prosperity. The more we managers, investors, consumers - think that economic growth is guaranteed and that risk and…arrow_forward
- 2.) Using the line drawing tool, plot and label the isocost line. Carefully follow the instructions above, and only draw the required objects. FILL IN BLANK d. Now suppose the price of labour rises to $5 per unit, but the firm still wants to produce 500 tires per day. Explain how a cost-minimizing firm adjusts to this change (with no change in technology). A cost-minimizing firm will be producing on ▼ The samedifferently slopedparallel isocost line. The firm will use ▼ moresameless labour and ▼ less the same amount of more capital and produce on ▼ a higher point on the same a lower point on the same a lower a higher isoquant curve.arrow_forwardQK Using the graph on the right, determine how the firm should change the quantity of the production factors in order to reduce the costs. The firm that is producing at point A can reduce its costs for producing 2000 units by employing A. same capital and more labour. B. less capital and more labour. ○ C. less capital and the same labour. D. more capital and more labour. OE. more capital and less labour. C A B Q =4000 Q = 2000 C Isocost line QLarrow_forwardPL Suppose the price ratio is the same along isocost PK lines A and B. In the figure at right, the difference between isocost line A and isocost line B is that A. the total cost is larger along B. B. the total cost is larger along A. OC. labour is relatively more expensive along A. ○ D. the level of output is lower along A. OE. both capital and labour are relatively cheaper along A. Capital B Labourarrow_forward
- Using the graph on the right, determine the per unit prices of capital and labour. 20- Given the information provided about the isocost lines, we know that the per unit price of capital is TC=$100 and the per unit price of labour is 16- TC $80 ○ A. $50; $20 ○ B. $2; $5 ○ C. $5; $2 ○ D. $20; $50 E. not determinable; not determinable Quantity of K 12 TC $60 TC $40 0 10 20 30 Quantity of L 40arrow_forwardThe diagram to the right contains isocost lines A and B. If the price of capital is the same for both lines, then the difference between isocost line A and isocost line B is that OA. the total cost is larger along B. B. the level of output is lower along A. C. both capital and labour are cheaper along A. OD. labour is more expensive along A. ○ E. labour is more expensive along B. Capital Labourarrow_forwardFor the firm whose cost curves are shown at right, the minimum efficient scale is ○ A. between 60 and 140 units of production. OB. about 20 units of production. OC. about 60 units of production. OD. about 100 units of production. OE. the level of fixed cost corresponding to SRATC2. SRATC₁ LRAC SRATC4 SRATC₂ SRATC3 เนด เad iso C 20 20 40 60 80 100 120 140 160 180 200 Output per Periodarrow_forward
- SRATC₂ SRATC3 In the figure, increasing long-run average total costs for the firm are confined to the output range OA. where the LRAC curve is downward sloping. B. above 80 units of output. O C. above 50 units of output. OD. between 50 and 80 units of output. SRATC₁ OE. between 10 and 100 units of output. ---- SRATC LRAC 10 20 30 40 50 60 70 80 90 100 Output per Periodarrow_forwardFor the firm whose cost curves are shown at right, the minimum efficient scale is OA. between 10 and 50 units of production. OB. about 80 units of production. O C. the level of fixed cost corresponding to SRATC₁. OD. about 10 units of production. ○ E. about 50 units of production. Cost per Unit SRATC₁ LRAC SRATC2 SRATC4 SRATC3 10 20 30 40 50 60 70 80 Output per Period 90 100arrow_forward• 3 different people working at any companies under the BPO industry in the Philippines. • What are the 3 different Vision, Mission, Duties and Responsibilities and Career Path of these people in their companies under the BPO industry?arrow_forward

 Principles of Economics (12th Edition)EconomicsISBN:9780134078779Author:Karl E. Case, Ray C. Fair, Sharon E. OsterPublisher:PEARSON
 Engineering Economy (17th Edition)EconomicsISBN:9780134870069Author:William G. Sullivan, Elin M. Wicks, C. Patrick KoellingPublisher:PEARSON
 Principles of Economics (MindTap Course List)EconomicsISBN:9781305585126Author:N. Gregory MankiwPublisher:Cengage Learning
 Managerial Economics: A Problem Solving ApproachEconomicsISBN:9781337106665Author:Luke M. Froeb, Brian T. McCann, Michael R. Ward, Mike ShorPublisher:Cengage Learning
 Managerial Economics & Business Strategy (Mcgraw-...EconomicsISBN:9781259290619Author:Michael Baye, Jeff PrincePublisher:McGraw-Hill Education