
Introductory Statistics
3rd Edition
ISBN: 9780135188927
Author: Gould, Robert, Ryan, Colleen N. (colleen Nooter)
Publisher: Pearson,
expand_more
expand_more
format_list_bulleted
Concept explainers
Videos
Textbook Question
Chapter 4, Problem 30SE
Mother and Daughter Heights The graph shows the heights of mothers and daughters. (Source: StatCrunch: Mother and Daughter Heights.xls. Owner: craig_slinkman)
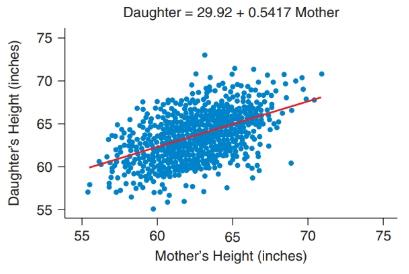
a. As the data are graphed, which is the independent variable and which the dependent variable?
b. From the graph, approximate the predicted height of the daughter of a mother who is 60 inches (5 feet) tall.
c. From the equation, determine the predicted height of the daughter of a mother who is 60 inches tall.
d. Interpret the slope.
e. What other factors besides mother’s height might influence the daughter’s height?
Expert Solution & Answer
Want to see the full answer?
Check out a sample textbook solution
Students have asked these similar questions
H0: mean egg weight is the same in all three diets
HA: there is at least one difference among the means
can you explain why my answer to Q2 was wrong and, how to get the correct answer
Business discuss
Chapter 4 Solutions
Introductory Statistics
Ch. 4 - GPA Predictors The scatterplots show SAT scores...Ch. 4 - Salary and Employment The first graph shows the...Ch. 4 - Age and Credits The scatterplot below shows data...Ch. 4 - Age and GPA The scatterplot shows data on age and...Ch. 4 - Credits and GPA (Example 1) The scatterplot shows...Ch. 4 - Salary and Education The scatterplot shows data on...Ch. 4 - Sisters and Brothers The scatterplot shows the...Ch. 4 - House Price and Area Describe the trend in the...Ch. 4 - Work and TV The scatterplot shows the number of...Ch. 4 - Work and Sleep The scatterplot shows the number of...
Ch. 4 - Age and Sleep The scatterplot shows the age and...Ch. 4 - Height and Weight for Women The figure shows a...Ch. 4 - College Tuition and ACT a. The first scatterplot...Ch. 4 - Ages of Women Who Give Birth The figure shows a...Ch. 4 - Law School The scatterplot shows the LSAT (Law...Ch. 4 - Medical School The scatterplot shows the...Ch. 4 - Matching Pick the letter of the graph that goes...Ch. 4 - Matching Pick the letter of the graph that goes...Ch. 4 - Matching Match each of the following correlations...Ch. 4 - Matching Match each of the following correlations...Ch. 4 - Airline Tickets (Example 2) The distance (in...Ch. 4 - Train Tickets The table for part (a) shows...Ch. 4 - SAT and GPA In Exercise 4.1 there is a graph of...Ch. 4 - House Price The correlation between house price...Ch. 4 - Rate My Professor Seth Wagerman, a former...Ch. 4 - Cousins Five people were asked how many female...Ch. 4 - GPA and Gym Use USA Today College published an...Ch. 4 - Education and Life Expectancy United Press...Ch. 4 - Salaries of College Graduates (Example 3) The...Ch. 4 - Mother and Daughter Heights The graph shows the...Ch. 4 - Median Weekly Earning by Gender The scatterplot...Ch. 4 - Home Prices and Size The scatterplot shows the...Ch. 4 - Height and Arm Span for Women (Example 4) TI-84...Ch. 4 - Hand and Foot Length for Women The computer output...Ch. 4 - Height and Arm Span for Men (Example 5)...Ch. 4 - Hand Length and Foot Length for Men Measurements...Ch. 4 - Comparing Correlation for Arm Span and Height The...Ch. 4 - Age and Weight for Men and Women The scatterplot...Ch. 4 - Singles and Doubles Winning Percentage The...Ch. 4 - Seesaw The figure shows a scatterplot of the...Ch. 4 - Choosing the Predictor and Response Variables...Ch. 4 - Choosing the Predictor and the Response Variable...Ch. 4 - Percentage of Smoke-Free Homes and Percentage of...Ch. 4 - Effect of Adult Smoking on High School Student...Ch. 4 - Car Insurance and Age The following graph shows...Ch. 4 - Life Insurance and Age The graph shows the monthly...Ch. 4 - How Is the Time of a Flight Related to the...Ch. 4 - Distance and Train Ticket Price The following...Ch. 4 - Do States with Higher Populations Have More...Ch. 4 - Movie Ratings The following table give the Rotten...Ch. 4 - Pitchers The table shows the Earned Run Average...Ch. 4 - Text Messages The following table shows the number...Ch. 4 - Answer the questions using complete sentences. a....Ch. 4 - Answer the questions using complete sentences. a....Ch. 4 - If there is a positive correlation between number...Ch. 4 - Suppose that the growth rate of children looks...Ch. 4 - Coefficient of Determination If the correlation...Ch. 4 - Coefficient of Determination Does a correlation of...Ch. 4 - Investing Some investors use a technique called...Ch. 4 - Blood Pressure Suppose a doctor telephones those...Ch. 4 - Salary and Year of Employment (Example 8) The...Ch. 4 - MPG: Highway and City The following figure shows...Ch. 4 - Cost of Turkeys The following table shows the...Ch. 4 - Wine Calories The table shows the calories in a...Ch. 4 - Teacher Pay and Expenditure Per Student (Example...Ch. 4 - Teacher Pay and High School Graduation Rates The...Ch. 4 - Does Having a Job Affect Students’ Grades?...Ch. 4 - Weight of Trash and Household Size Data were...Ch. 4 - Predicting Home Runs Data on the number of home...Ch. 4 - Predicting 3-Point Baskets Data on the 3-point...Ch. 4 - 4th-Grade Reading and Math Scores Data from the...Ch. 4 - SAT Scores The following table shows the average...Ch. 4 - Test Scores Assume that in a political science...Ch. 4 - Test Scores Assume that in a sociology class, the...Ch. 4 - Heights and Weights of People The following table...Ch. 4 - Heights and Weights of Men The table shows the...Ch. 4 - Prob. 77CRECh. 4 - Granola Bars The following table shows the fat...Ch. 4 - Shoe Size and Height The scatterplot shows the...Ch. 4 - Age and Sleep The following scatterplot shows the...Ch. 4 - Age and Weight The following scatterplot shows the...Ch. 4 - Heights and Test Scores a. The following figure...Ch. 4 - Law School Selectivity and Employment The...Ch. 4 - Prob. 84CRECh. 4 - Prob. 87CRECh. 4 - Fuel-Efficient Cars The following table gives the...Ch. 4 - Tall Buildings The following scatterplot shows...Ch. 4 - For 4.91 through 4.94 show your points in a rough...Ch. 4 - For 4.91 through 4.94 show your points in a rough...Ch. 4 - For 4.91 through 4.94 show your points in a rough...Ch. 4 - For 4.91 through 4.94 show your points in a rough...Ch. 4 - The following figure shows a scatterplot of the...Ch. 4 - Wages and Education The figure shows a scatterplot...Ch. 4 - Do Students Taking More Units Study More Hours?...Ch. 4 - Hours of Exercise and Hours of Homework The...Ch. 4 - Children’s Ages and Heights The following figure...Ch. 4 - Blackjack Tips The following figure shows the...Ch. 4 - Decrease in Cholesterol A doctor is studying...Ch. 4 - Prob. 102CRE
Additional Math Textbook Solutions
Find more solutions based on key concepts
Is there a relationship between wine consumption and deaths from heart disease? The table gives data from 19 de...
College Algebra Essentials (5th Edition)
Silvia wants to mix a 40% apple juice drink with pure apple juice to make 2 L of a juice drink that is 80% appl...
Beginning and Intermediate Algebra
(a) Make a stem-and-leaf plot for these 24 observations on the number of customers who used a down-town CitiBan...
APPLIED STAT.IN BUS.+ECONOMICS
True or False The quotient of two polynomial expressions is a rational expression, (p. A35)
Precalculus
The largest polynomial that divides evenly into a list of polynomials is called the _______.
Elementary & Intermediate Algebra
Knowledge Booster


Learn more about
Need a deep-dive on the concept behind this application? Look no further. Learn more about this topic, statistics and related others by exploring similar questions and additional content below.Similar questions
- BUSINESS DISCUSSarrow_forwardA researcher wishes to estimate, with 90% confidence, the population proportion of adults who support labeling legislation for genetically modified organisms (GMOs). Her estimate must be accurate within 4% of the true proportion. (a) No preliminary estimate is available. Find the minimum sample size needed. (b) Find the minimum sample size needed, using a prior study that found that 65% of the respondents said they support labeling legislation for GMOs. (c) Compare the results from parts (a) and (b). ... (a) What is the minimum sample size needed assuming that no prior information is available? n = (Round up to the nearest whole number as needed.)arrow_forwardThe table available below shows the costs per mile (in cents) for a sample of automobiles. At a = 0.05, can you conclude that at least one mean cost per mile is different from the others? Click on the icon to view the data table. Let Hss, HMS, HLS, Hsuv and Hмy represent the mean costs per mile for small sedans, medium sedans, large sedans, SUV 4WDs, and minivans respectively. What are the hypotheses for this test? OA. Ho: Not all the means are equal. Ha Hss HMS HLS HSUV HMV B. Ho Hss HMS HLS HSUV = μMV Ha: Hss *HMS *HLS*HSUV * HMV C. Ho Hss HMS HLS HSUV =μMV = = H: Not all the means are equal. D. Ho Hss HMS HLS HSUV HMV Ha Hss HMS HLS =HSUV = HMVarrow_forward
- Question: A company launches two different marketing campaigns to promote the same product in two different regions. After one month, the company collects the sales data (in units sold) from both regions to compare the effectiveness of the campaigns. The company wants to determine whether there is a significant difference in the mean sales between the two regions. Perform a two sample T-test You can provide your answer by inserting a text box and the answer must include: Null hypothesis, Alternative hypothesis, Show answer (output table/summary table), and Conclusion based on the P value. (2 points = 0.5 x 4 Answers) Each of these is worth 0.5 points. However, showing the calculation is must. If calculation is missing, the whole answer won't get any credit.arrow_forwardBinomial Prob. Question: A new teaching method claims to improve student engagement. A survey reveals that 60% of students find this method engaging. If 15 students are randomly selected, what is the probability that: a) Exactly 9 students find the method engaging?b) At least 7 students find the method engaging? (2 points = 1 x 2 answers) Provide answers in the yellow cellsarrow_forwardIn a survey of 2273 adults, 739 say they believe in UFOS. Construct a 95% confidence interval for the population proportion of adults who believe in UFOs. A 95% confidence interval for the population proportion is ( ☐, ☐ ). (Round to three decimal places as needed.)arrow_forward
- Find the minimum sample size n needed to estimate μ for the given values of c, σ, and E. C=0.98, σ 6.7, and E = 2 Assume that a preliminary sample has at least 30 members. n = (Round up to the nearest whole number.)arrow_forwardIn a survey of 2193 adults in a recent year, 1233 say they have made a New Year's resolution. Construct 90% and 95% confidence intervals for the population proportion. Interpret the results and compare the widths of the confidence intervals. The 90% confidence interval for the population proportion p is (Round to three decimal places as needed.) J.D) .arrow_forwardLet p be the population proportion for the following condition. Find the point estimates for p and q. In a survey of 1143 adults from country A, 317 said that they were not confident that the food they eat in country A is safe. The point estimate for p, p, is (Round to three decimal places as needed.) ...arrow_forward
- (c) Because logistic regression predicts probabilities of outcomes, observations used to build a logistic regression model need not be independent. A. false: all observations must be independent B. true C. false: only observations with the same outcome need to be independent I ANSWERED: A. false: all observations must be independent. (This was marked wrong but I have no idea why. Isn't this a basic assumption of logistic regression)arrow_forwardBusiness discussarrow_forwardSpam filters are built on principles similar to those used in logistic regression. We fit a probability that each message is spam or not spam. We have several variables for each email. Here are a few: to_multiple=1 if there are multiple recipients, winner=1 if the word 'winner' appears in the subject line, format=1 if the email is poorly formatted, re_subj=1 if "re" appears in the subject line. A logistic model was fit to a dataset with the following output: Estimate SE Z Pr(>|Z|) (Intercept) -0.8161 0.086 -9.4895 0 to_multiple -2.5651 0.3052 -8.4047 0 winner 1.5801 0.3156 5.0067 0 format -0.1528 0.1136 -1.3451 0.1786 re_subj -2.8401 0.363 -7.824 0 (a) Write down the model using the coefficients from the model fit.log_odds(spam) = -0.8161 + -2.5651 + to_multiple + 1.5801 winner + -0.1528 format + -2.8401 re_subj(b) Suppose we have an observation where to_multiple=0, winner=1, format=0, and re_subj=0. What is the predicted probability that this message is spam?…arrow_forward
arrow_back_ios
SEE MORE QUESTIONS
arrow_forward_ios
Recommended textbooks for you
 Glencoe Algebra 1, Student Edition, 9780079039897...AlgebraISBN:9780079039897Author:CarterPublisher:McGraw Hill
 Holt Mcdougal Larson Pre-algebra: Student Edition...AlgebraISBN:9780547587776Author:HOLT MCDOUGALPublisher:HOLT MCDOUGAL
 Big Ideas Math A Bridge To Success Algebra 1: Stu...AlgebraISBN:9781680331141Author:HOUGHTON MIFFLIN HARCOURTPublisher:Houghton Mifflin Harcourt
Glencoe Algebra 1, Student Edition, 9780079039897...
Algebra
ISBN:9780079039897
Author:Carter
Publisher:McGraw Hill
Holt Mcdougal Larson Pre-algebra: Student Edition...
Algebra
ISBN:9780547587776
Author:HOLT MCDOUGAL
Publisher:HOLT MCDOUGAL
Big Ideas Math A Bridge To Success Algebra 1: Stu...
Algebra
ISBN:9781680331141
Author:HOUGHTON MIFFLIN HARCOURT
Publisher:Houghton Mifflin Harcourt
The Shape of Data: Distributions: Crash Course Statistics #7; Author: CrashCourse;https://www.youtube.com/watch?v=bPFNxD3Yg6U;License: Standard YouTube License, CC-BY
Shape, Center, and Spread - Module 20.2 (Part 1); Author: Mrmathblog;https://www.youtube.com/watch?v=COaid7O_Gag;License: Standard YouTube License, CC-BY
Shape, Center and Spread; Author: Emily Murdock;https://www.youtube.com/watch?v=_YyW0DSCzpM;License: Standard Youtube License