
(a)
Assume the following information for
| Demand | Demand | Supply | Supply |
| Quantity demanded | Price | Quantity supplied | |
| | | | |
| | | | |
| | | | |
| | | | |
| | | | |
| | | | |
| | | | |
| | | | |
| | | | |
| | | | |
Illustrate demand and supply curve.
Answer to Problem 25P
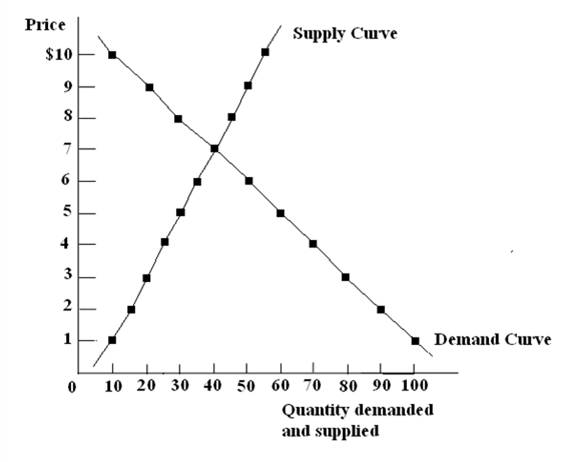
Following graph represents the demand and supply curve of good Z
Explanation of Solution
The above graph represents the supply and demand curve of good Z. The intersecting point is the equilibrium point at which the demand for the products is equal to the supply of the products. The upward movement of the supply curve represents that with an increase in the price of the product the supplier will increase the supply whereas the downwards movement of the demand curve represents a decrease in demand of the product with an increase in the price of the product.
Introduction:
Demand and supply curve represents relationship between the quantity of product a supplier supplies in the market and quantity of product consumers demands. The point where supply and demand curve meets is referred to as
(b)
Assume the following information for demand and supply curve for good Z
| Demand | Demand | Supply | Supply |
| Price | Quantity demanded | Price | Quantity supplied |
| | | | |
| | | | |
| | | | |
| | | | |
| | | | |
| | | | |
| | | | |
| | | | |
| | | | |
| | | | |
Determine the equilibrium price and the quantity traded
Answer to Problem 25P
In the given data the equilibrium price is
Explanation of Solution
In the given table, one can observe that at price
Therefore, the equilibrium price is
Introduction:
Equilibrium price is the price at which the amount of quantity supplied is equal to the amount of quantity demanded, it is the price at which both the supplier and consumer is ready to trade the goods.
The amount of quantity traded in between in the suppliers and consumers are the
(c)
Assume the following information for demand and supply curve for good Z
| Demand | Demand | Supply | Supply |
| Price | Quantity demanded | Price | Quantity supplied |
| | | | |
| | | | |
| | | | |
| | | | |
| | | | |
| | | | |
| | | | |
| | | | |
| | | | |
| | | | |
Determine whether it is surplus or shortage at price
Answer to Problem 25P
At price
Explanation of Solution
In the given table at price,
Since the quantity supplied is more than quantity demanded, therefore there is surplus at price
To calculate surplus
Thus the surplus at price
Introduction:
Surplus occurs when the quantity supplied by the supplier exceeds the quantity demanded in the market.
Shortage occurs when the quantity demanded by the consumers exceeds the quantity supplied by the supplier in the market.
(d)
Assume the following information for demand and supply curve for good Z
| Demand | Demand | Supply | Supply |
| Price | Quantity demanded | Price | Quantity supplied |
| | | | |
| | | | |
| | | | |
| | | | |
| | | | |
| | | | |
| | | | |
| | | | |
| | | | |
| | | | |
Determine whether it is surplus or shortage at price
Answer to Problem 25P
At price
Explanation of Solution
In the given table at price,
To calculate shortage
Therefore ate price
Introduction:
Surplus occurs when the quantity supplied by the supplier exceeds the quantity demanded in the market.
Shortage occurs when the quantity demanded by the consumers exceeds the quantity supplied by the supplier in the market
(e)
Assume the following information for demand and supply curve for good Z
| Demand | Demand | Supply | Supply |
| Price | Quantity demanded | Price | Quantity supplied |
| | | | |
| | | | |
| | | | |
| | | | |
| | | | |
| | | | |
| | | | |
| | | | |
| | | | |
| | | | |
Determine the new equilibrium price and quantity traded if demand for Z increased by
Answer to Problem 25P
New equilibrium price of the good is
Explanation of Solution
According to the given situation, the quantity demanded increases by
Therefore the new quantity demanded is represented in the table below
| Demand | Demand | Demand | Supply | Supply |
| Price | Quantity demanded | New Quantity after addition of 15 Units | Price | Quantity supplied |
| | | | | |
| | | | | |
| | | | | |
| | | | | |
| | | | | |
| | | | | |
| | | | | |
| | | | | |
| | | | | |
| | | | | |
After the addition of 15 units in quantity demanded column, one can observe the equilibrium price shifted at price
Introduction:
Equilibrium price is the price at which the amount of quantity supplied is equal to the amount of quantity demanded, it is the price at which both the supplier and consumer is ready to trade the goods.
(f)
Assume the following information for demand and supply curve for good Z
| Demand | Demand | Supply | Supply |
| Price | Quantity demanded | Price | Quantity supplied |
| | | | |
| | | | |
| | | | |
| | | | |
| | | | |
| | | | |
| | | | |
| | | | |
| | | | |
| | | | |
Determine the new equilibrium price and quantity traded if the supply of Z is increased by
Answer to Problem 25P
When the supply is increased by 15 units the new equilibrium price will be
Explanation of Solution
The new supply column when the supply of Z is increased by 15 units at each price point is shown as below
| Demand | Demand | Supply | Supply | |
| Price | Quantity demanded | Price | Quantity supplied | New quantity supplied with addition of 15 units |
| | | | | |
| | | | | |
| | | | | |
| | | | | |
| | | | | |
| | | | | |
| | | | | |
| | | | | |
| | | | | |
| | | | | |
After the addition of 15 units in the supply column one can observe that the equilibrium is shifted at price
Introduction:
Equilibrium price is the price at which the amount of quantity supplied is equal to the amount of quantity demanded, it is the price at which both the supplier and consumer is ready to trade the goods.
Want to see more full solutions like this?
Chapter 4 Solutions
EBK EXPLORING ECONOMICS

- Problem 2 Experiments/Randomized Control Trial Suppose you are interested in studying the effect of academic counselling on the years it takes for a student to obtain an undergraduate degree. You conduct a randomized control trial to answer the question. You randomly assign 2500 individuals in a university in New York to receive academic counselling and 2500 students to not receive any academic counselling. a. Which people are a part of the treatment group and which people are a part of the control group? (5 points) b. What regression will you run? Define the variables where required. (5 points) Λ c. Suppose you estimate ß₁ = -0.3. Interpret it. (5 points) 1 d. You test for balance using the variables mentioned in the table below. Based on the results do you think that the treatment and control group are balanced? If your answer is "yes" then explain why. If your answer is "no", then explain why and mention how will you address the issue of imbalance. (10 points) Variable GPA Average…arrow_forwardProblem 1 Experiments/Randomized Control Trial Suppose you are interested in studying the effect of being a part of the labor union on an individual's hourly wage. You collect data on 1000 people and run the following regression. Wage=Bo+B₁Labor Union; + &¿ where Labor Union is a dummy variable which is equal t to 1 for people who are a part of labor union and 0 for others. a. Suppose you estimate b. Do you think B₁ = 1.6. Interpret B₁ (5 points) 1 1 is biased or unbiased? Explain. (5 points) Now suppose you conduct a randomized control trial to answer the same question. You randomly assign some individuals to be a part of the labor union and others to not be a part of the labor union. The first step you take is to ensure that the randomization was done correctly. Then you estimate the following equation: = Wage, Bo+B₁Treatment; + &; Treatment =1 if the student is assigned to be a part of Labor Union Treatment=0 if the student is assigned to not be a part of Labor Union c. Why is it…arrow_forwardThe figure to the right contains a point indicating the economy's initial price and aggregate output (Upper P 0P0,Upper Y 0Y0) combination. Suppose that the price level rises such that P Subscript 1 > P Subscript 0. Using the point drawing tool, identify a potential location for the economy's new price and aggregate output (Upper P 1P1,Upper Y 1Y1) combination. Label this point B. Using the line drawing tool, draw the aggregate demand curve through these points. Properly label the line. picture is attachedarrow_forward
- Question content area left Part 1 The figure to the right gives an economy's initial aggregate demand (AD) curve. Using the line drawing tool, show a decrease in aggregate demand. Properly label this line. Part 2 Note: Carefully follow the instructions above and only draw the required object. Part 3 Which of the following will generate a decrease in aggregate demand? A. Increased government expenditures for infrastructure. B. A tax increase. C. An increase in the price level. D. An increase in the money supply.arrow_forwardA movie theater is showing two different movies: a Hollywood blockbuster (with 100 customers willing to pay $10 for a ticket, and 100 willing to pay $8) and an independent film that attracts 50 film buffs, willing to pay $20 each. Marginal costs are zero and neither movie can fill theater capacity. What is the theater's maximum profit if it cannot price discriminate (it must charge the same price for both movies) and if it can price discriminate (it may charge different prices for different movies)? a. $2,000; $2,600 b. $1,500; $2,100 c. $1,500; $2,000arrow_forwardA movie theater is showing two different movies: a Hollywood blockbuster (with 100 customers willing to pay $10 for a ticket, and 100 willing to pay $8) and an independent film that attracts 50 film buffs, willing to pay $20 each. Marginal costs are zero and neither movie can fill theater capacity. What is the theater's maximum profit if it cannot price discriminate (it must charge the same price for both movies) and if it can price discriminate (it may charge different prices for different movies)? a. $2,000; $2,600 b. $1,500; $2,100 c. $1,500; $2,000arrow_forward
- What profi is most important in business ?arrow_forward5. Download the Excel sheet from Brightspace. The data contains the GDP per capita and GNI per capita of OECD member countries in 2014 (both figures are reported in US dollars). The countries are ranked by GDP per capita. a. Compute the ratio of GNI to GDP for each country (GNI per capita/GDP per capita). What does this imply about net factor income from abroad for each country? b. Rank the countries based on the GNI/GDP ratio, starting with the country with the highest ratio and ending with the country with the lowest ratio. Which country has the highest ratio, and which has the lowest? c. Comment on why the countries you identified in the previous question have a large difference between GDP and GNI? What does the difference imply?arrow_forward3. Answer the following questions about external wealth. a. Home has external wealth of $100 million in period t. In t+1, Home purchases $160 million foreign assets, and Foreign purchases $120 million in Home assets. Assume a world interest rate of 10% per annum. Compute the "change" in external wealth at t+1 for Home. b. A country's external wealth was -$1.5 billion at the end of 2015, and its trade balance was $750 million in 2016. Assume the world interest rate is 5% per annum. What is the "value" of a country's external wealth at the end of 2016?arrow_forward
- 1. The table below shows a country's hypothetical national income and product accounts data. Category Consumption (personal consumption expenditures) Investment (gross private domestic investment) Government consumption (government expenditures) Exports Imports Net Factor Income from Abroad Net unilateral transfers Billions of Dollars 8,000 1,300 2,100 900 1,750 +45 -20 a. Compute the following accounts using the information in the table: Gross national expenditure (GNE) . Trade balance (TB) • Gross domestic product (GDP) • Gross national income (GNI) . Gross national disposable income (GNDI) Current account (CA) b. Derive the current account identity using the national income identity. Are savings greater than or smaller than investment in this country? The national income identity is: GNDIGNE + CA, GNE = C + G + I.arrow_forward4. Assume that a country produces an output Q of 50 every year. The world interest rate is 10%. Consumption C is 50 every year, and I = G = 0. There is an unexpected drop in output in year 0, so output falls to 28 and is then expected to return to 50 in every future year. If the country desires to smooth consumption, how much should it borrow in period 0? What will the new level of consumption be from then on?arrow_forward2. Show how each of the following would affect the following US balance of payments: trade balance (TB), net factor income abroad (NFIA), net unilateral transfers (NUT), financial account (FA), and capital account (KA). Identify which specific account is affected in each case (e.g., +$10 in TB). Note that the sum of the balance of payment accounts is zero. Example: A California computer manufacturer purchases a $50 hard disk from a Malaysian company, paying the funds from a bank account in Malaysia. Answer: The US imports a hard disk from Malaysia: TB = $50 The US draws a foreign asset to pay for the import (less external asset): FA = +$50. (Note: The balance of payment identity holds: CA + FA (+KA) = −- $50 + $50 = 0. No KA in this example.) a. A US tourist in Japan sells his iPod to a local resident for yen worth $100. (hint: A US tourist obtains Japanese currency.) b. A US owner of Honda shares receives $10,000 in dividend payments, which are paid into a Tokyo bank. c. The central…arrow_forward
 Exploring EconomicsEconomicsISBN:9781544336329Author:Robert L. SextonPublisher:SAGE Publications, Inc
 Economics (MindTap Course List)EconomicsISBN:9781337617383Author:Roger A. ArnoldPublisher:Cengage Learning

 Microeconomics: Principles & PolicyEconomicsISBN:9781337794992Author:William J. Baumol, Alan S. Blinder, John L. SolowPublisher:Cengage Learning