
Concept explainers
(a):
The equilibrium
(a):
Explanation of Solution
The equilibrium demand and supply of milk in the economy can be obtained at the point of intersection of the market demand and supply curves in the economy. The market demand and supply schedules are given, and a graph can be plotted on the basis of the schedule as follows:
|
Quantity demanded (millions of gallons) |
Quantity supplied (millions of gallons) | |
| $10.00 | 100 | 500 |
| 8.00 | 200 | 400 |
| 6.00 | 300 | 300 |
| 4.00 | 400 | 200 |
| 2.00 | 500 | 100 |
Based on this table, it is identified that the quantity supplied increases as price increases and there is a direct and positive relation between the price and quantity supplied. On the other hand, there is a negative relation between the quantity demanded and price because the quantity demanded decreases as price increases. Thus, the quantity demanded will be indicated by a downward sloping curve, whereas the quantity supplied will be indicated by an upward sloping curve as follows:
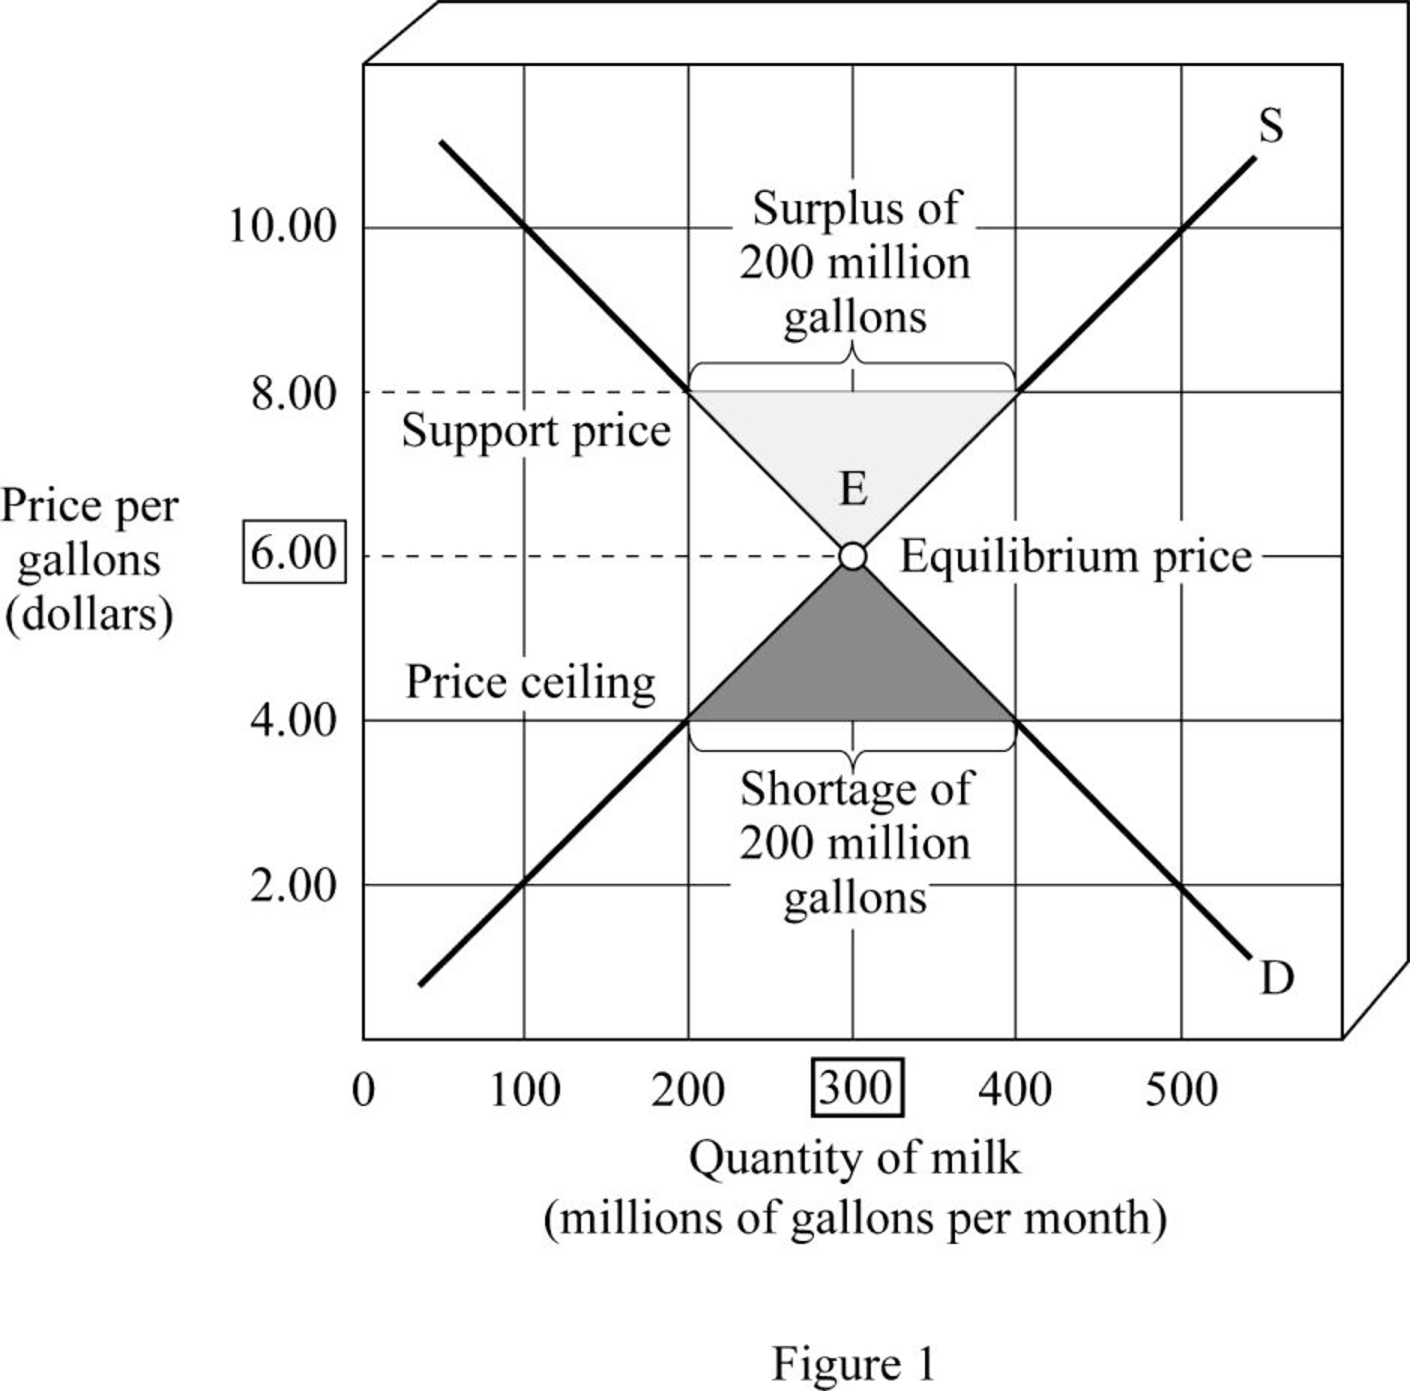
From the diagram, it is observed that the market demand for milk and the supply of milk intersect at Point E. The corresponding quantity at Point E will be the
Equilibrium: Equilibrium in the market is obtained at the point where the market demand is equal to the market supply, and there is no excess demand or supply present in the economy.
(b):
The effect of support price of $8 per gallon of milk.
(b):
Explanation of Solution
From the diagram, it is observed that the market demand for milk and the supply of milk intersect at Point E. The corresponding quantity Point E will be the equilibrium quantity of milk and the corresponding price Point E will be the equilibrium price of the milk. Thus, at the point of equilibrium E, the equilibrium price is $6 per gallon and the quantity is 300 gallons per month.
However, when the government enacts the support price of $8 per gallon, the market price will be $8 per gallon. The quantity demanded at this price is 200 gallons per month, whereas the quantity supplied is 400 gallons per month. This means that there will be a surplus of 200 gallons of milk in the economy. The government has to purchase this excess surplus from the market. Since the government revenue is the tax revenue, the non–milk-drinking taxpayers have to pay for the milk indirectly.
(c):
The effect of ceiling price of $4 per gallon of milk.
(c):
Explanation of Solution
When the government enacts the ceiling price of $4 per gallon, the market price will be $4 per gallon. The quantity demanded at this price is 400 gallons per month, whereas the quantity supplied is 200 gallons per month. This means that there will be a shortage of 200 gallons of milk in the economy. The government has to ration the milk in order to prevent the black marketing of milk. This is caused due to the action of the government to keep the price of milk below the equilibrium level of $6 per gallon.
Want to see more full solutions like this?
Chapter 4 Solutions
EBK MACROECONOMICS FOR TODAY


- In a paragraph, no bullet, points please answer the question and follow the instructions. Give only the solution: Use the Feynman technique throughout. Assume that you’re explaining the answer to someone who doesn’t know the topic at all. 8. How does monetary policy supposedly translate into changes in AD?arrow_forwardIn a paragraph, no bullet, points please answer the question and follow the instructions. Give only the solution: Use the Feynman technique throughout. Assume that you’re explaining the answer to someone who doesn’t know the topic at all. 2. Carefully explain either Keynes’ “cookie jar” motive for holding money or the “saw-toothed model’s” motive for holding a safety stock.arrow_forwardIn a paragraph, no bullet, points please answer the question and follow the instructions. Give only the solution: Use the Feynman technique throughout. Assume that you’re explaining the answer to someone who doesn’t know the topic at all. 7.Carefully explain the Fisher equation for interest rates. What insight does it provide?arrow_forward
- In a paragraph, no bullet, points please answer the question and follow the instructions. Give only the solution: Use the Feynman technique throughout. Assume that you’re explaining the answer to someone who doesn’t know the topic at all. 3. Describe the general architecture of the Federal Reserve System.arrow_forwardIn a paragraph, no bullet, points please answer the question and follow the instructions. Give only the solution: Use the Feynman technique throughout. Assume that you’re explaining the answer to someone who doesn’t know the topic at all. 1. Define money. Carefully explain the three functions of money.arrow_forwardIn a paragraph, no bullet, points please answer the question and follow the instructions. Give only the solution: Use the Feynman technique throughout. Assume that you’re explaining the answer to someone who doesn’t know the topic at all. 5.Draw the Federal Reserve System’s Balance Sheet and briefly explain each of the main (highlighted in the PowerPoints and text) components.arrow_forward
- In a paragraph, no bullet, points please answer the question and follow the instructions. Give only the solution: Use the Feynman technique throughout. Assume that you’re explaining the answer to someone who doesn’t know the topic at all. 9. What are monetary rules? How are they carried out and what is the difference between monetary rules and discretionary behavior?arrow_forwardIn a paragraph, no bullet, points please answer the question and follow the instructions. Give only the solution: Use the Feynman technique throughout. Assume that you’re explaining the answer to someone who doesn’t know the topic at all. 4. What is interest payment on reserve balances used for? How does it work?arrow_forwardA linear programming computer package is needed. As part of the settlement for a class action lawsuit, Hoxworth Corporation must provide sufficient cash to make the following annual payments (in thousands of dollars). Year 1 2 3 4 5 6 Payment 170 195 220 265 295 440 The annual payments must be made at the beginning of each year. The judge will approve an amount that, along with earnings on its investment, will cover the annual payments. Investment of the funds will be limited to savings (at 4% annually) and government securities, at prices and rates currently quoted in The Wall Street Journal. Hoxworth wants to develop a plan for making the annual payments by investing in the following securities (par value = $1,000). Funds not invested in these securities will be placed in savings. Security Current Price Rate (%) Years to Maturity 1 $1,055 6.750 3 2 $1,000 5.125 4 Assume that interest is paid annually. The plan will be submitted to the judge and, if approved,…arrow_forward
- On the 1st of April 2018, the South African National Treasury increase the value-added tax rate from 14% to 15%. This policy change had a wide-ranging impact on society. Discuss some of the benefits and drawbacks of making use of this type of tax to generate government revenue and what we may expect in terms of its impact on inflation and GDP growth within the economy. Please use some of the economics graphs to explain some scenariosarrow_forwardEskom is South Africa’s monopoly power producer which the majority of South Africans depend on. Suppose there is extensive deregulation in the power industry. What is the impact of this deregulation on the industry? Help me on discussing the new market structure as well as the impact on supply and demand. Use the relevant diagrams.arrow_forwardDiscuss the impact of exchange rate volatility on the economy and its impact on your organisation. Make use of the relevant diagrams.arrow_forward


 Economics (MindTap Course List)EconomicsISBN:9781337617383Author:Roger A. ArnoldPublisher:Cengage Learning

 Exploring EconomicsEconomicsISBN:9781544336329Author:Robert L. SextonPublisher:SAGE Publications, Inc