Concept explainers
(a):
The equilibrium
(a):
Explanation of Solution
The equilibrium demand and supply of milk in the economy can be obtained at the point of intersection of the market demand and supply curves in the economy. The market demand and supply schedules are given, and a graph can be plotted on the basis of the schedule as follows:
|
Quantity demanded (millions of gallons) |
Quantity supplied (millions of gallons) | |
| $10.00 | 100 | 500 |
| 8.00 | 200 | 400 |
| 6.00 | 300 | 300 |
| 4.00 | 400 | 200 |
| 2.00 | 500 | 100 |
Based on this table, it is identified that the quantity supplied increases as price increases and there is a direct and positive relation between the price and quantity supplied. On the other hand, there is a negative relation between the quantity demanded and price because the quantity demanded decreases as price increases. Thus, the quantity demanded will be indicated by a downward sloping curve, whereas the quantity supplied will be indicated by an upward sloping curve as follows:
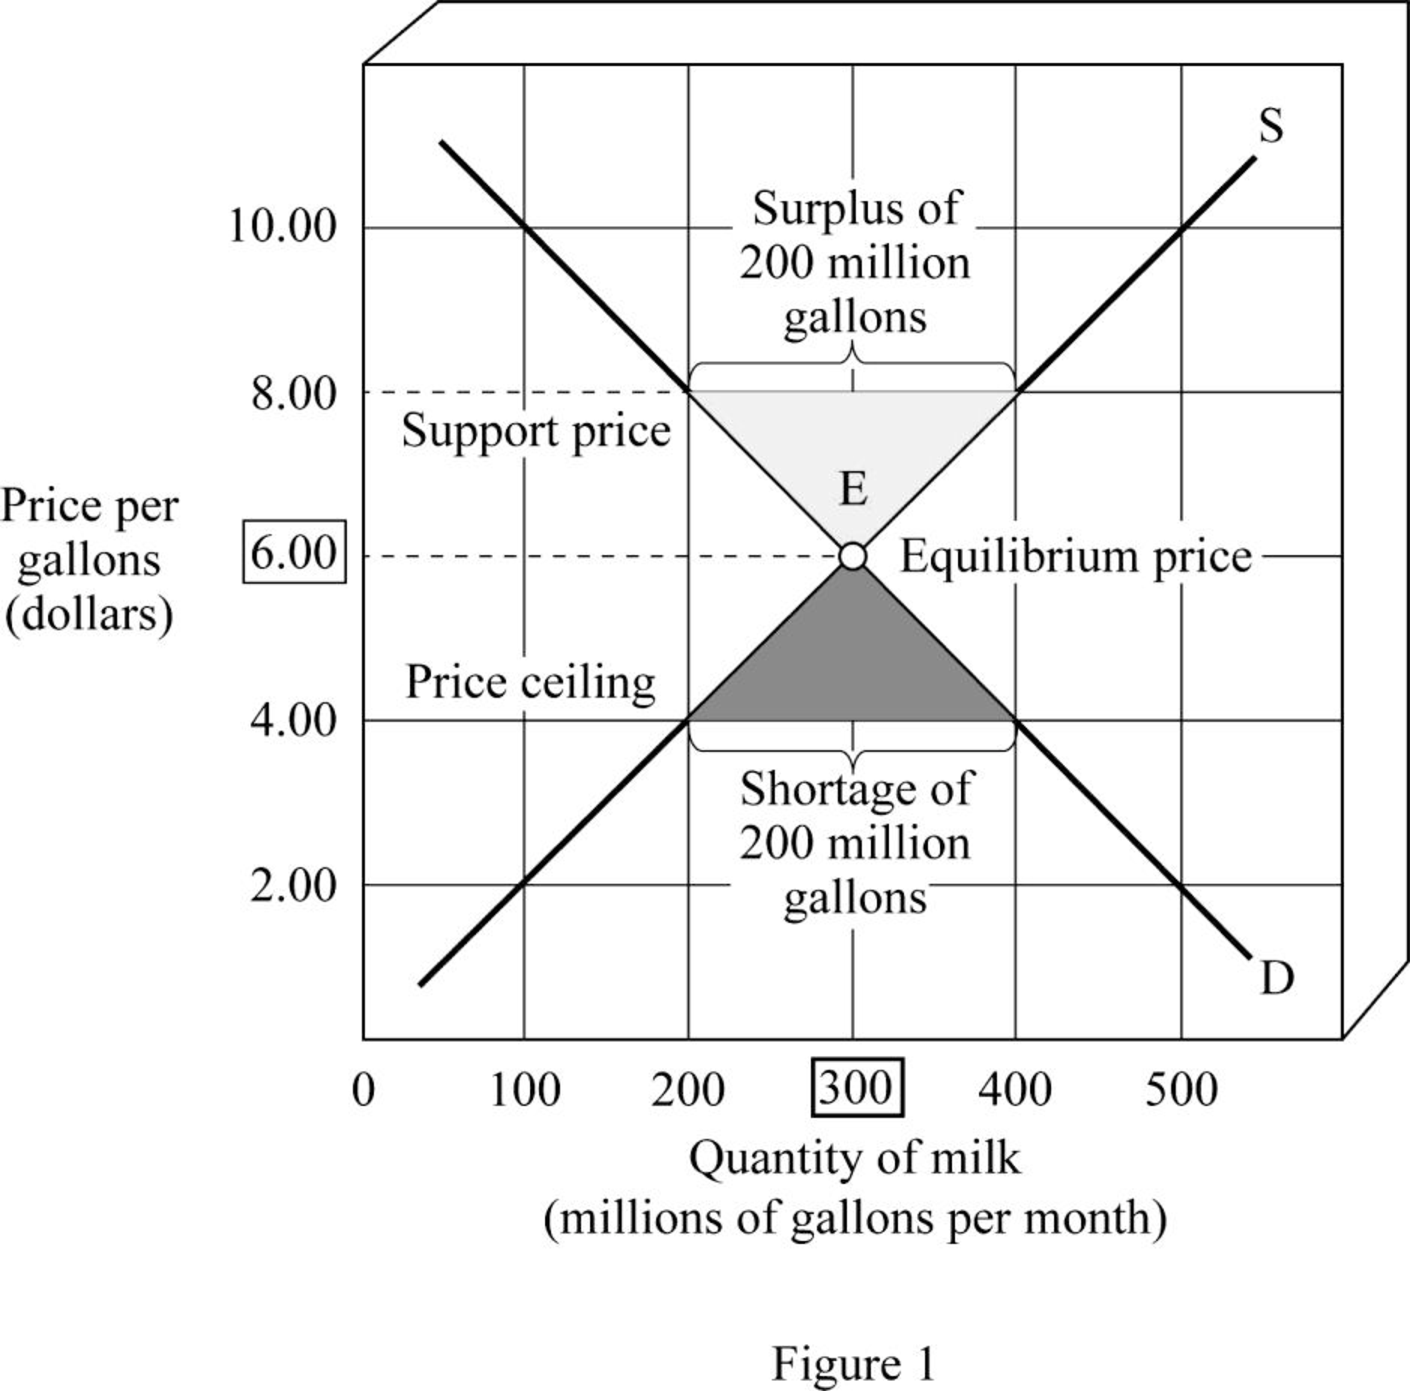
From the diagram, it is observed that the market demand for milk and the supply of milk intersect at Point E. The corresponding quantity at Point E will be the
Equilibrium: Equilibrium in the market is obtained at the point where the market demand is equal to the market supply, and there is no excess demand or supply present in the economy.
(b):
The effect of support price of $8 per gallon of milk.
(b):
Explanation of Solution
From the diagram, it is observed that the market demand for milk and the supply of milk intersect at Point E. The corresponding quantity Point E will be the equilibrium quantity of milk and the corresponding price Point E will be the equilibrium price of the milk. Thus, at the point of equilibrium E, the equilibrium price is $6 per gallon and the quantity is 300 gallons per month.
However, when the government enacts the support price of $8 per gallon, the market price will be $8 per gallon. The quantity demanded at this price is 200 gallons per month, whereas the quantity supplied is 400 gallons per month. This means that there will be a surplus of 200 gallons of milk in the economy. The government has to purchase this excess surplus from the market. Since the government revenue is the tax revenue, the non–milk-drinking taxpayers have to pay for the milk indirectly.
(c):
The effect of ceiling price of $4 per gallon of milk.
(c):
Explanation of Solution
When the government enacts the ceiling price of $4 per gallon, the market price will be $4 per gallon. The quantity demanded at this price is 400 gallons per month, whereas the quantity supplied is 200 gallons per month. This means that there will be a shortage of 200 gallons of milk in the economy. The government has to ration the milk in order to prevent the black marketing of milk. This is caused due to the action of the government to keep the price of milk below the equilibrium level of $6 per gallon.
Want to see more full solutions like this?
Chapter 4 Solutions
EBK ECONOMICS FOR TODAY


- Critically analyse the five (5) characteristics of Ubuntu and provide examples of how they apply to the National Health Insurance (NHI) in South Africa.arrow_forwardCritically analyse the five (5) characteristics of Ubuntu and provide examples of how they apply to the National Health Insurance (NHI) in South Africa.arrow_forwardOutline the nine (9) consumer rights as specified in the Consumer Rights Act in South Africa.arrow_forward
- In what ways could you show the attractiveness of Philippines in the form of videos/campaigns to foreign investors? Cite 10 examples.arrow_forwardExplain the following terms and provide an example for each term: • Corruption • Fraud • Briberyarrow_forwardIn what ways could you show the attractiveness of a country in the form of videos/campaigns?arrow_forward


 Economics (MindTap Course List)EconomicsISBN:9781337617383Author:Roger A. ArnoldPublisher:Cengage Learning

 Exploring EconomicsEconomicsISBN:9781544336329Author:Robert L. SextonPublisher:SAGE Publications, Inc