The reason for more often use of term food web instead of the food chain for species in a community.
Answer to Problem 1RQ
In the food chain, each level consists of single species whereas in food web several species occupy a single level. That is the reason that food web is commonly used in place of the food chain.
Explanation of Solution
Pictorial representation: Fig.1 represents a food web. Fig.2 represents food chain.
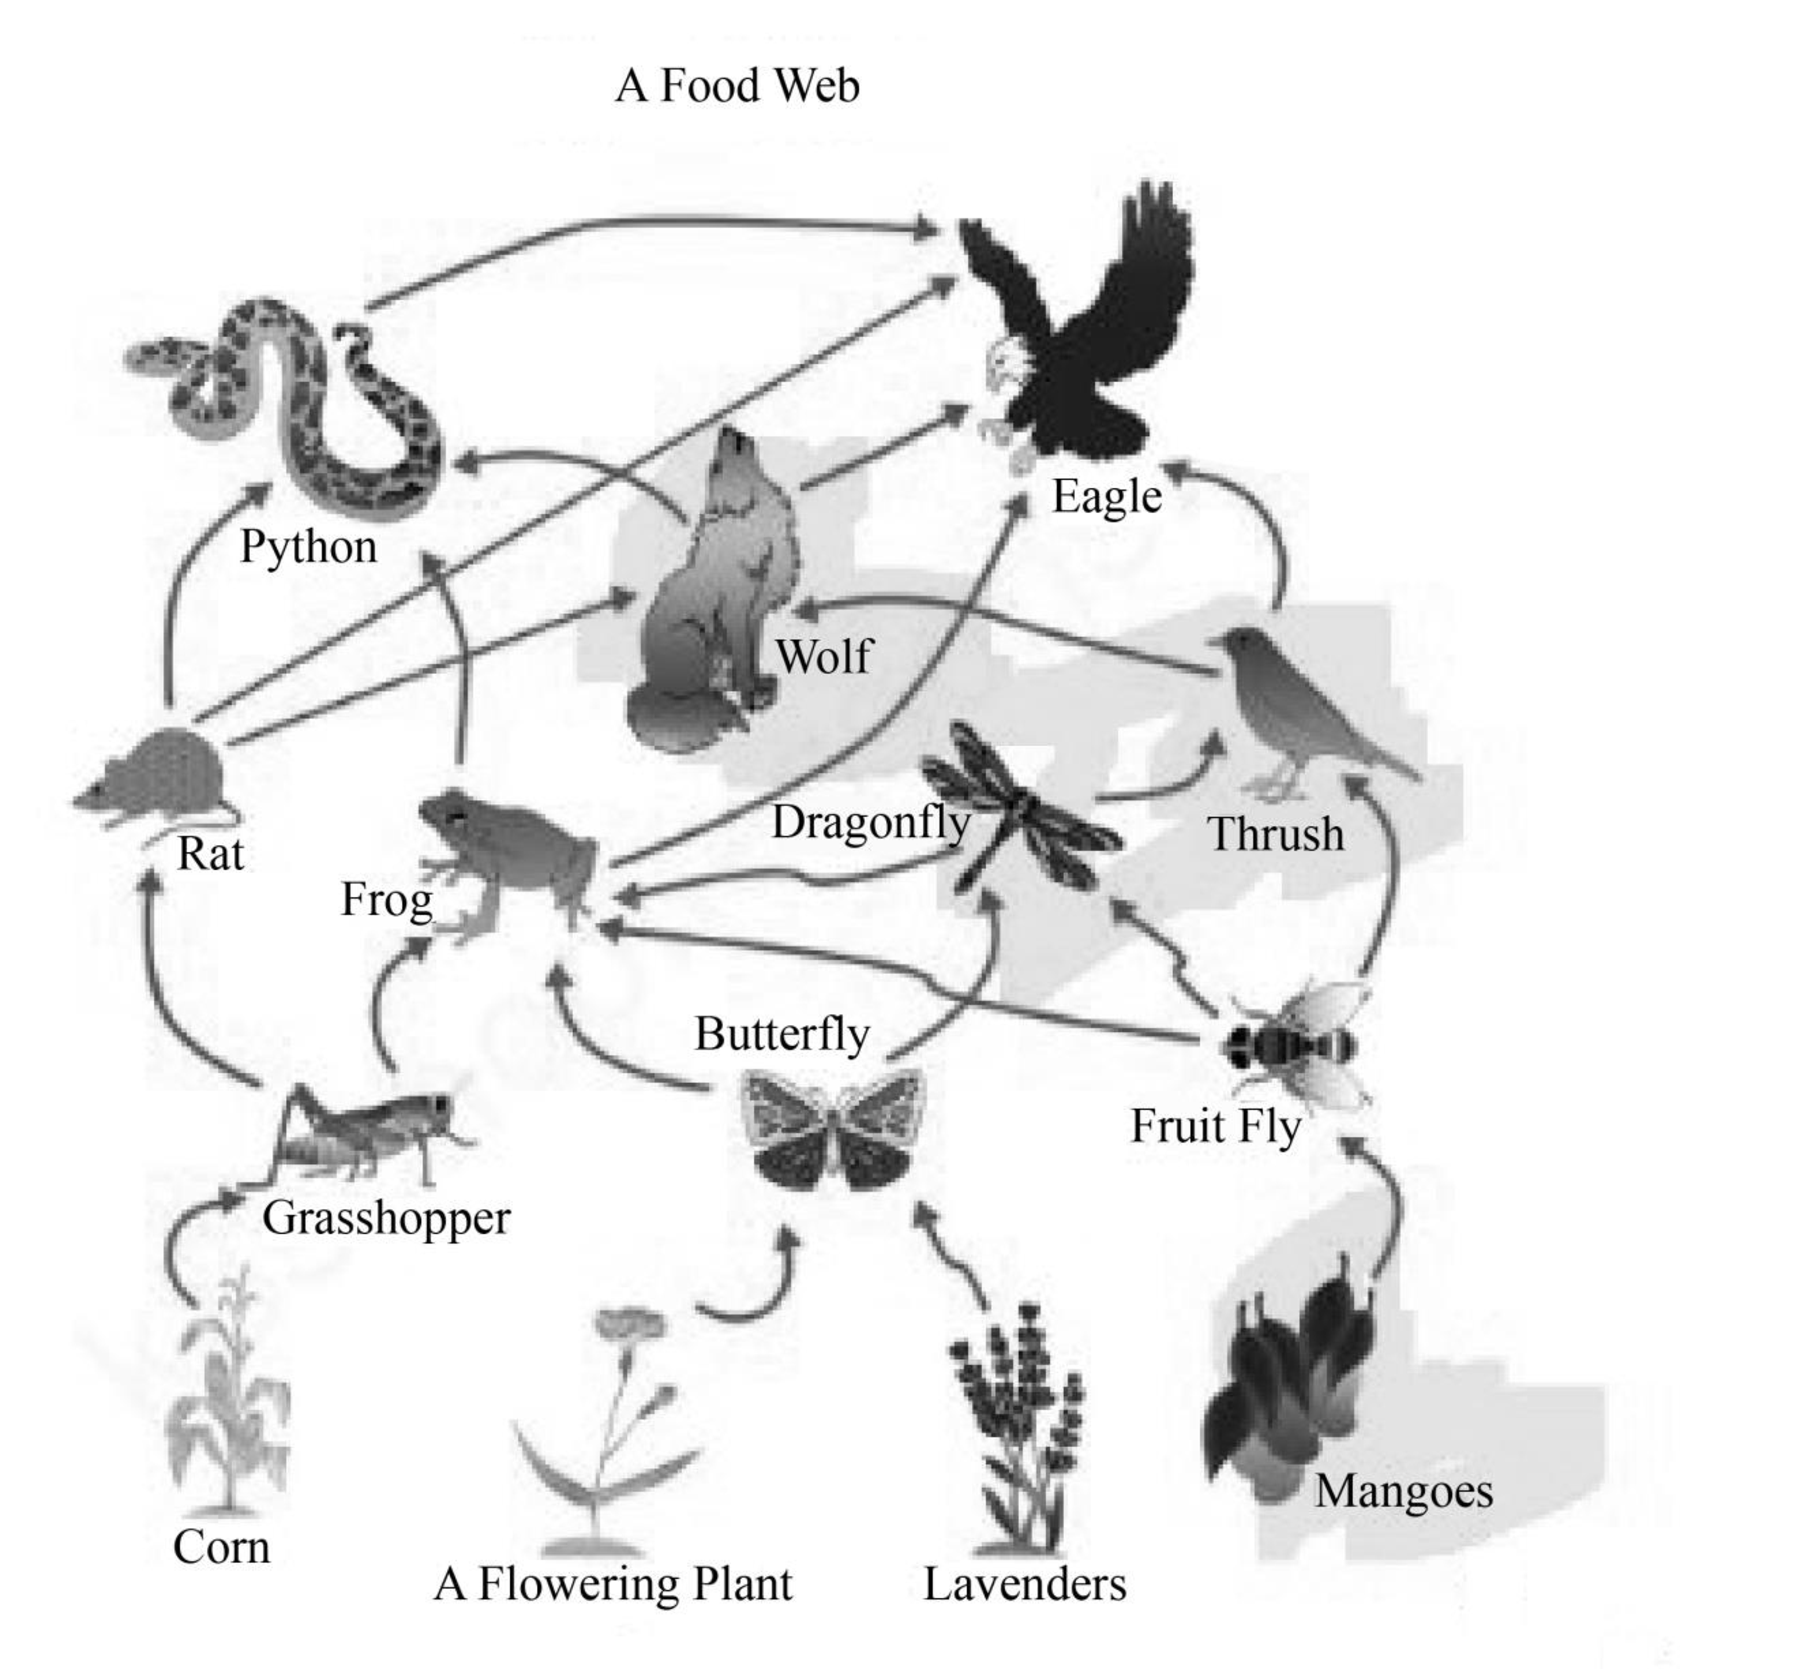
Fig.1: Food web
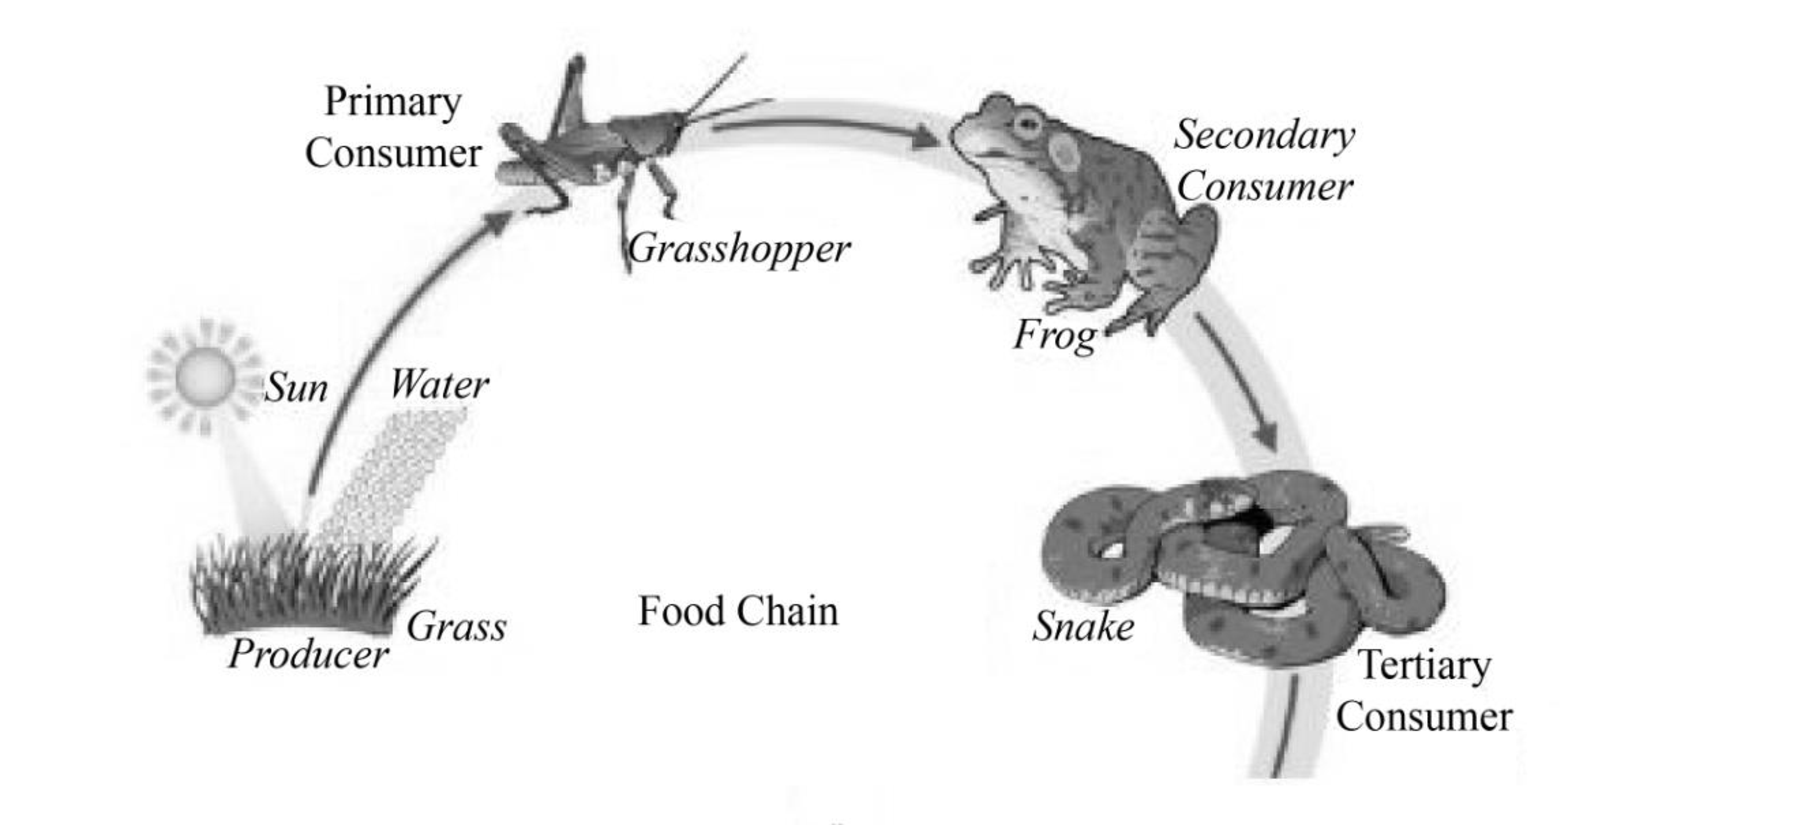
Fig.2: Food chain.
In an ecosystem, plants are primary producer which perform photosynthesis. Herbivorous animals feed on plants and they are called primary consumers. Carnivorous feed on herbivorous animals and called secondary consumers. Top carnivores feed on secondary consumers so they are called tertiary consumers.
(i) Food chain: Food chain is sequence based upon the feeding habits of organism living in a community. The basic sequence is from producers to tertiary consumers. For example, plants are producers, a grasshopper used to feed on plants, the grasshopper is consumed by a frog and frog is further consumed by a snake. In this way, the food chain continues.
(ii) Food web: In a food web, each level is occupied by several species. The consumer not only feeds on only one kind of prey, they usually feed on several kinds of prey. For example, a grasshopper, a butterfly and fruit fly feed on plants. These insects can be consumed by a frog. The frog can be consumed by a snake or an eagle.
Food web is more appropriate instead of the food chain because in food chain each species occupy only one level, but in reality, each level is occupied by several species.
Want to see more full solutions like this?

- the questions often be used to determine the age ofmetamorphic rocks.Questions1. List the relative age of the rocks in Figure 2with oldest first.2. What stratigraphic principles did you use todetermine the age of the rocks in Figure 2?3. If layer A is 418 Ma and layer B is 388 Ma, what geological Period(s) are layers C and D likely to befrom?4. Layer C contains fish fossils.a. Circle the rock type for layer C. Igneous Sedimentary Metamorphicb. Explain how the fish fossils could be used to determine the date of rocks elsewhere.c. Outline possible reasons why the other layers do NOT contain fossilarrow_forwardthe questions often be used to determine the age ofmetamorphic rocks.Questions1. List the relative age of the rocks in Figure 2with oldest first.2. What stratigraphic principles did you use todetermine the age of the rocks in Figure 2?3. If layer A is 418 Ma and layer B is 388 Ma, what geological Period(s) are layers C and D likely to befrom?4. Layer C contains fish fossils.a. Circle the rock type for layer C. Igneous Sedimentary Metamorphicb. Explain how the fish fossils could be used to determine the date of rocks elsewhere.c. Outline possible reasons why the other layers do NOT contain fossilarrow_forwardDiscussion Question: Atmospheric Energy and Global Temperatures Albedo values (% reflected) Fresh snow 80%-95% Grass 25-30% Forests 10%-20% Crops, grasslands 10%-25% Asphat (black top 5%-10% Cancel 17-27 Moon Water bodies 10%-60% (varies with Sun altitude) Earth's albedo (average) 31% Dark roof 8%-18% Light roof 35%-50% Brick, stone 20%-40%arrow_forward
- Outline of topic: Increased urbanization together with climate changes forces cities to find solutions for their simultaneous water shortage and flooding problems. The preservation of water resources needs sustainable urban water management strategies that combine ecological health maintenance with these priorities. This study investigates combined strategies that involve rainwater collection together with wastewater treatment and the deployment of green infrastructure consisting of urban wetlands alongside permeable pavements. The research aims to discover multi-purpose solutions that decrease flood dangers together with water shortages while maintaining ecological health for long-term urban water management success. The research investigates ways in which novel solutions assist cities to create watertight urban areas capable of handling environmental pressures from global warming and population expansion. Research questions: What are the economic, environmental, and social benefits…arrow_forwardTitle: Implementing low impact development: Sustainable water management solutions for urban areas Research questions: What are the economic, environmental, and social benefits of integrating wastewater recycling systems into urban water management practices? What methods can cities employ to resolve water supply needs with natural resource defense while achieving long-term water resource sustainability? Please answer all questions in the pictures in detailarrow_forwardMap 2. Parts 1 through 7. I Dont understand how to answer these questions on the map. Please help me step by step.arrow_forward
- I desperately need help understanding and doing assignment step by step please. Parts 1 through 7 for the one question.arrow_forwardMap 2 parts 1 through 7. I need help with the steps and to understand how to complete the assignment. 1) On the map, draw a single red pencil line that represents the kern river recharge axis. 2) on the map draw 3 to 5 additional red lines in closing what appear to be other smaller recharge areas, possibly the locations of isolated individual recharge points. 3) on the map, draw for useful spaced blue pencil lines that represent groundwater flow from the kern river recharge access into the basin north of the river. 5) on the map, draw any necessary, additional blue pencil lines to fully illustrate groundwater flow from the current river recharge axis. 6) what is the groundwater gradient immediately north of the main recharge area? 7) what is the groundwater gradient immediately south of the main recharge area?arrow_forwardPlease answer all questions and all part questions in detail and show all workarrow_forward
 Applications and Investigations in Earth Science ...Earth ScienceISBN:9780134746241Author:Edward J. Tarbuck, Frederick K. Lutgens, Dennis G. TasaPublisher:PEARSON
 Exercises for Weather & Climate (9th Edition)Earth ScienceISBN:9780134041360Author:Greg CarbonePublisher:PEARSON
 Environmental ScienceEarth ScienceISBN:9781260153125Author:William P Cunningham Prof., Mary Ann Cunningham ProfessorPublisher:McGraw-Hill Education
 Earth Science (15th Edition)Earth ScienceISBN:9780134543536Author:Edward J. Tarbuck, Frederick K. Lutgens, Dennis G. TasaPublisher:PEARSON
 Environmental Science (MindTap Course List)Earth ScienceISBN:9781337569613Author:G. Tyler Miller, Scott SpoolmanPublisher:Cengage Learning
 Physical GeologyEarth ScienceISBN:9781259916823Author:Plummer, Charles C., CARLSON, Diane H., Hammersley, LisaPublisher:Mcgraw-hill Education,