
The reason for more often use of term food web instead of the food chain for species in a community.
Answer to Problem 1RQ
In the food chain, each level consists of single species whereas in food web several species occupy a single level. That is the reason that food web is commonly used in place of the food chain.
Explanation of Solution
Pictorial representation: Fig.1 represents a food web. Fig.2 represents food chain.
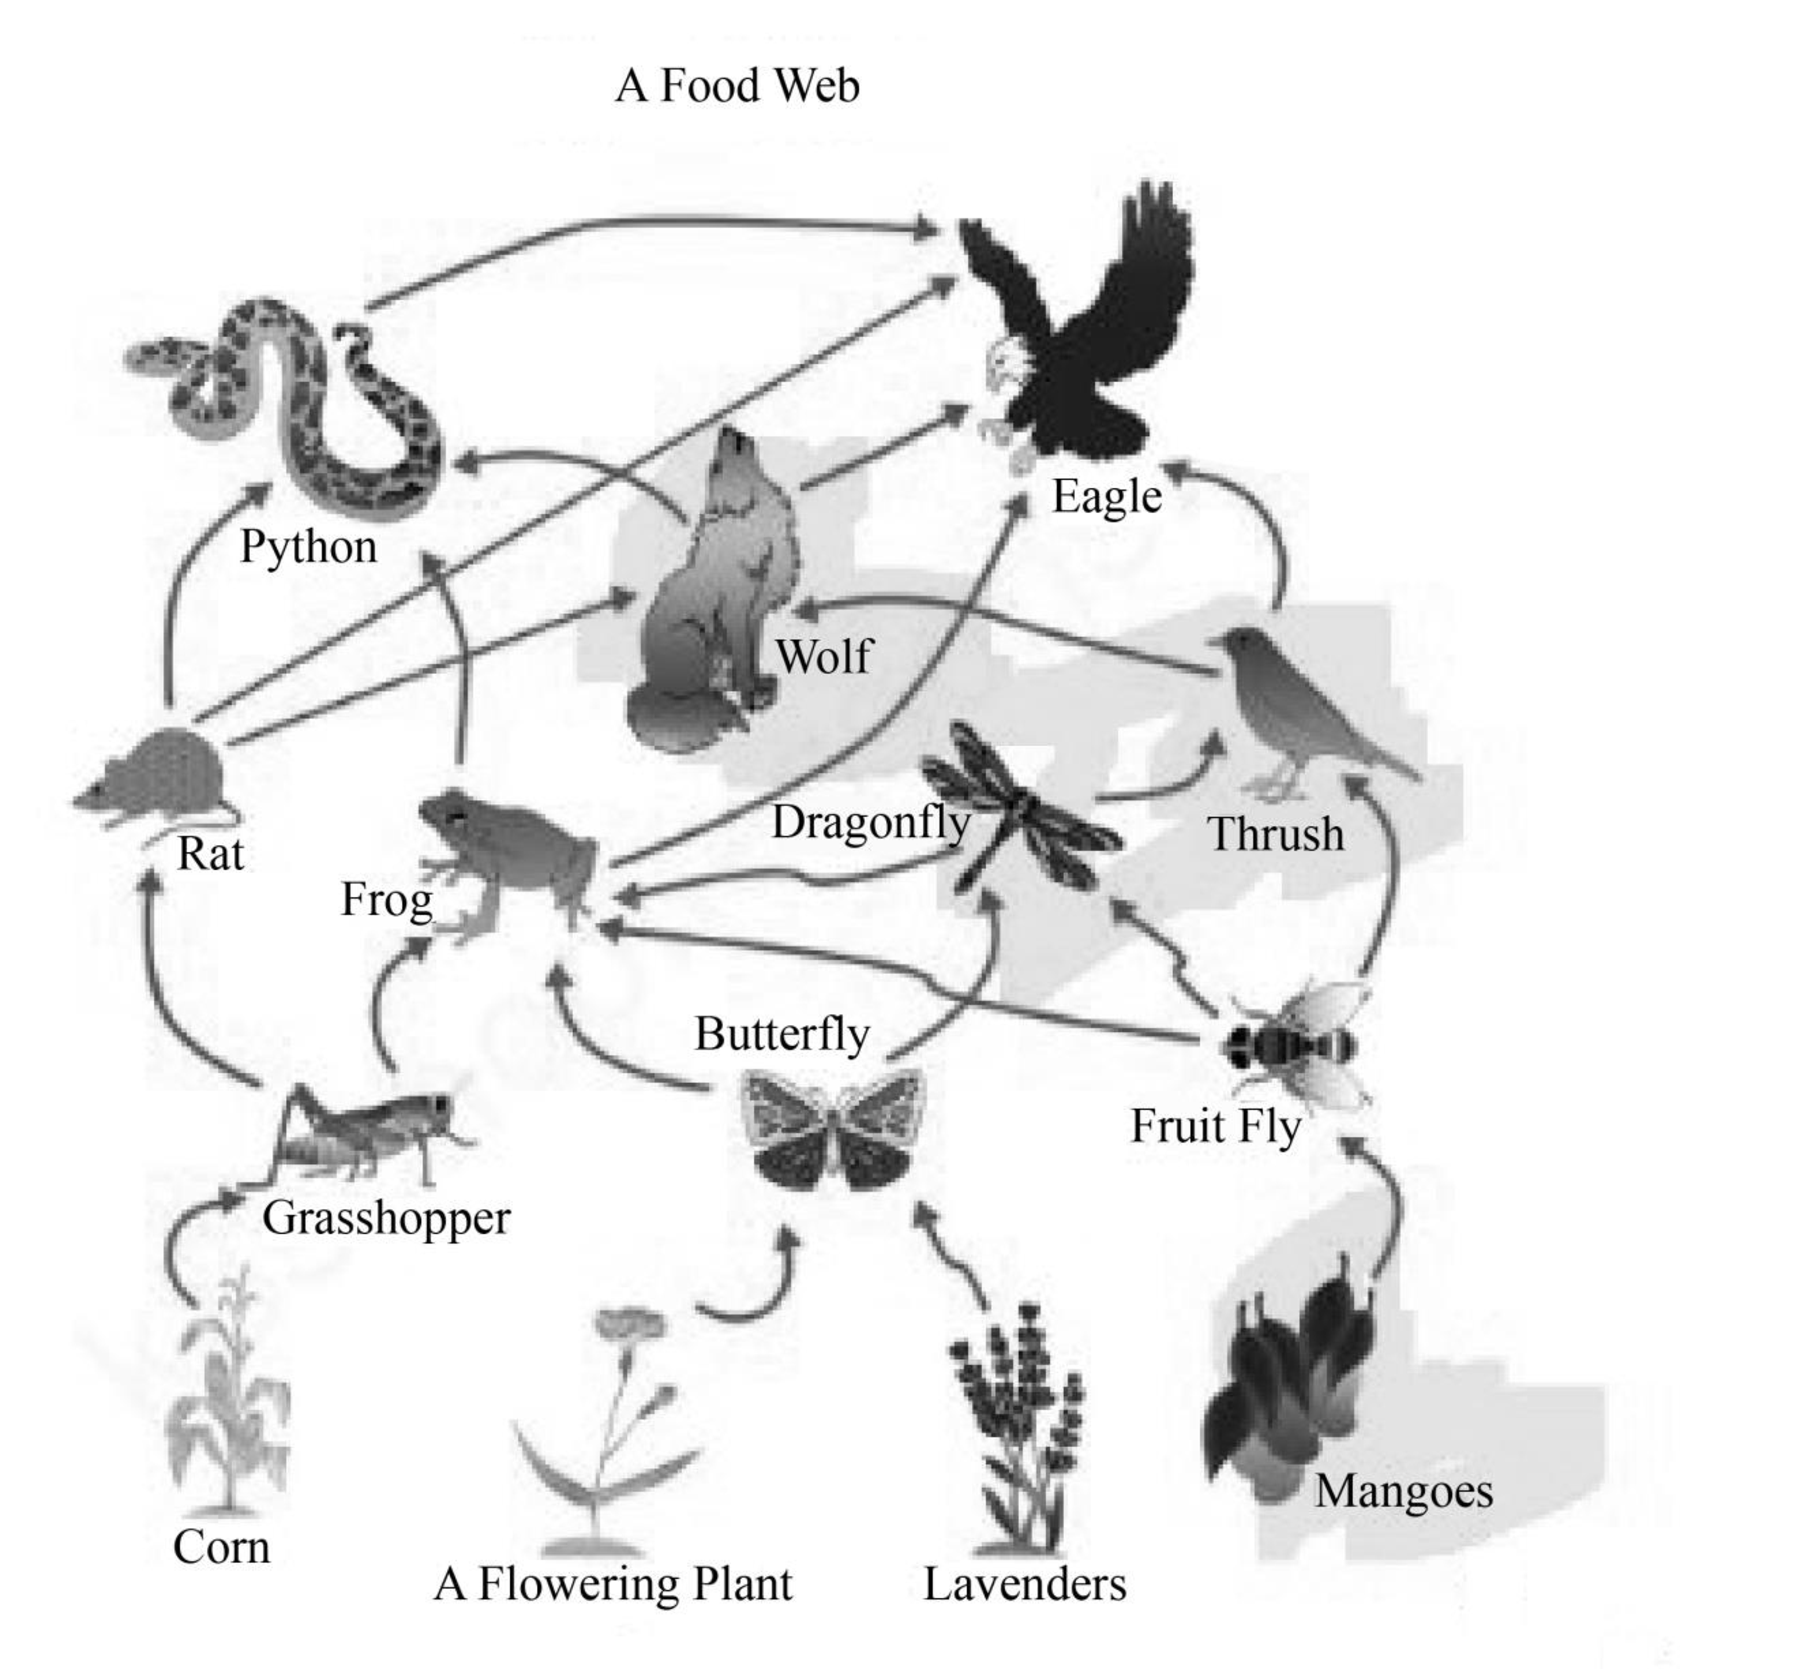
Fig.1: Food web
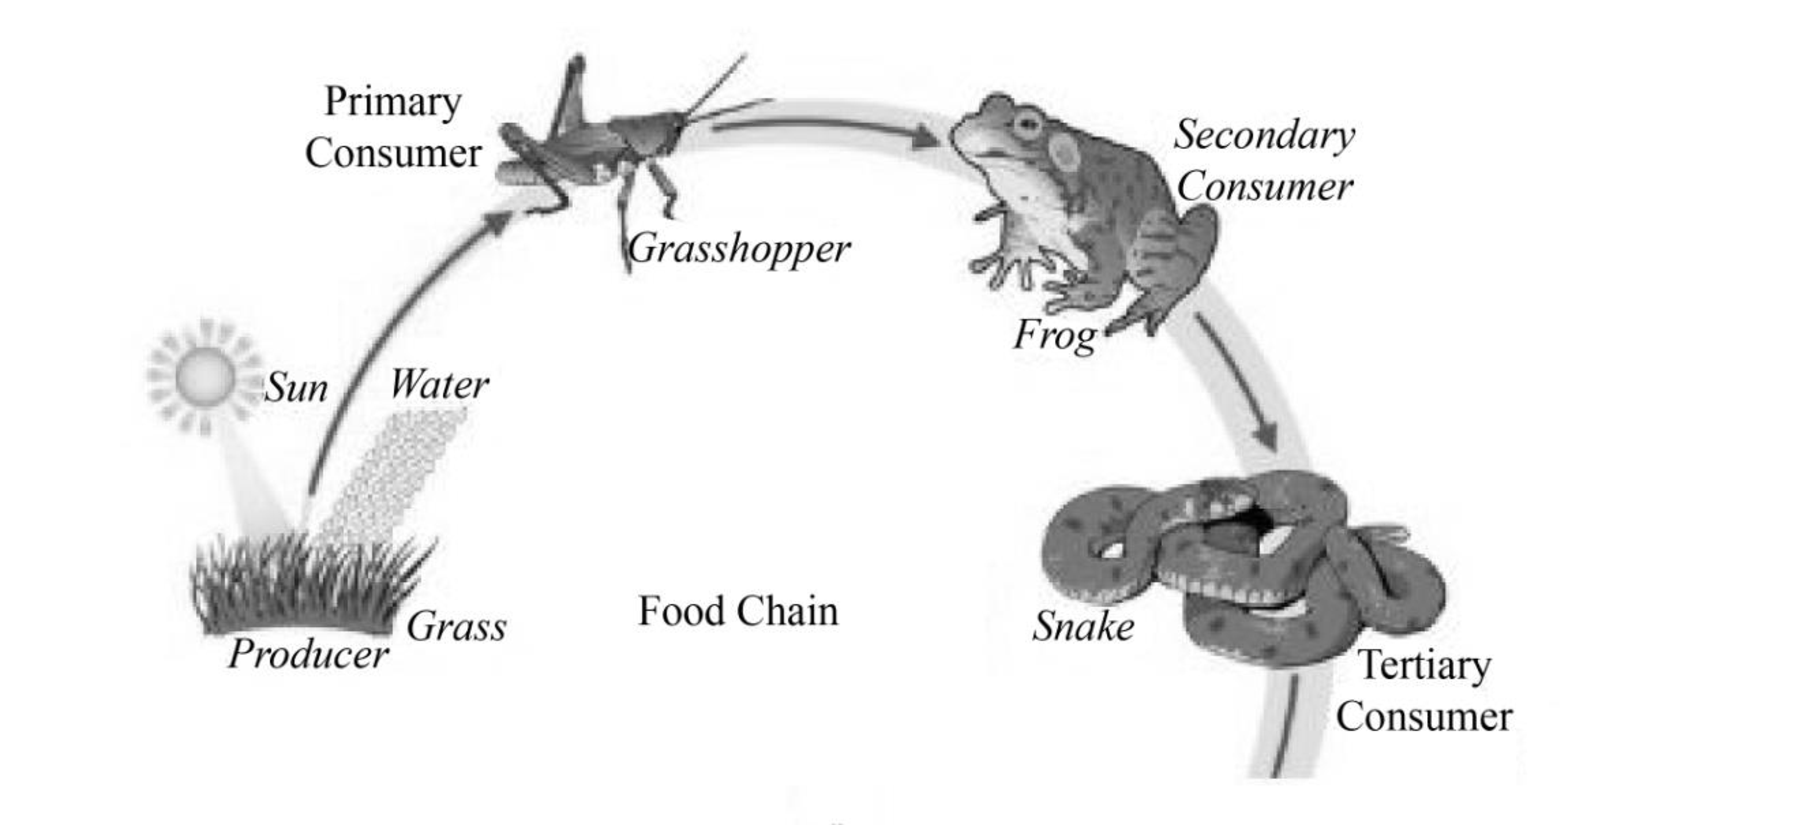
Fig.2: Food chain.
In an ecosystem, plants are primary producer which perform photosynthesis. Herbivorous animals feed on plants and they are called primary consumers. Carnivorous feed on herbivorous animals and called secondary consumers. Top carnivores feed on secondary consumers so they are called tertiary consumers.
(i) Food chain: Food chain is sequence based upon the feeding habits of organism living in a community. The basic sequence is from producers to tertiary consumers. For example, plants are producers, a grasshopper used to feed on plants, the grasshopper is consumed by a frog and frog is further consumed by a snake. In this way, the food chain continues.
(ii) Food web: In a food web, each level is occupied by several species. The consumer not only feeds on only one kind of prey, they usually feed on several kinds of prey. For example, a grasshopper, a butterfly and fruit fly feed on plants. These insects can be consumed by a frog. The frog can be consumed by a snake or an eagle.
Food web is more appropriate instead of the food chain because in food chain each species occupy only one level, but in reality, each level is occupied by several species.
Want to see more full solutions like this?
Chapter 4 Solutions
Earth System History 4e & Launchpad Solo For Earth System History (six Months Access)

- A) List three things that can be measured from annual layers of ice cores. 1 2 3.arrow_forward1. Use the descriptions of shoreline features provided above to label the structures in Figures 12.5 and 12.6. The same feature may appear more than once. 2. Next to each of the features listed below, indicate whether it is the result of erosional or depositional processes.Sea stack: Wave-cut cliff:Spit:Barrier island:Baymouth bar:Marine terrace:arrow_forwardActivity 12.5B: Identifying Shoreline Features on a Topographic Map Pg 209The area shown on the Point Reyes, California, topographic map is located directly to the southwest of the San Andreas Fault, in a very tectonically active region (Figure 12.10). As a result, some of this region has recently been uplifted and exhibits characteristics of an emergent coastline. On the other hand, because of the general rise in sea level over the past several thousand years, other areas exhibit features associated with submergent coastlines. Refer to this topographic map to complete the following. 1. What type of shoreline feature is Drakes Estero (located near the center of the map)? 2. Point Reyes, located in the bottom-left corner of the map, is a headland undergoing severe wave erosion. What type of feature is Chimney Rock, located off the shore of Point Reyes? 3. Several depositional features near Drakes Estero are related to the movement of sediment by longshore currents. What type of…arrow_forward
- Activity 12.3: Wave Refraction Pgs 202-203Figure 12.2 is a map view of a headland along a coastline. The water depths are shown by blue contour lines. As you complete the following questions, assume that waves with a wavelength of 60 feet are approaching the shoreline from the bottom left of the figure. 1. At approximately what water depth-10, 20, 30, or 40 feet-will the approaching waves begin to touch bottom and slow down? (Hint: Recall that this occurs when the water depth is one-half the wavelength.) 2. Using the wave shown in Figure 12.2 as a starting point, sketch a series of lines to illustrate the wave refraction that will occur as the wave approaches the shore by following these steps:Step 1: Mark the position on the 30-foot contour line where the wave front will first touch bottom.Step 2: Knowing that the section of the wave that touches bottom will slow down first, sketch the shape of the wave front when it reaches the 20-foot contour line.Step 3: Using the same…arrow_forwardCan trace and tell me how they did itarrow_forwardCan someone show me how they would trace thisarrow_forward
- I need help with this part E.arrow_forwardDiscussion Question: Ecosystems Essentials A+ shof 1000 Exo-spil The Human Denominator Assignment As we learn about how the earth works, we learn to identify the different earth spheres and how they overlap and affect one another. An understanding of the Earth's systems and spheres takes practice. More importantly, we can see the "Domino Effect" of the spheres as they interact with one another. We have learned that while endogenic processes are separate from exogenic process, the lithosphere affects the atmosphere which affects the hydrosphere, and thearrow_forwardI need help with part c and darrow_forward
 Applications and Investigations in Earth Science ...Earth ScienceISBN:9780134746241Author:Edward J. Tarbuck, Frederick K. Lutgens, Dennis G. TasaPublisher:PEARSON
 Exercises for Weather & Climate (9th Edition)Earth ScienceISBN:9780134041360Author:Greg CarbonePublisher:PEARSON
 Environmental ScienceEarth ScienceISBN:9781260153125Author:William P Cunningham Prof., Mary Ann Cunningham ProfessorPublisher:McGraw-Hill Education
 Earth Science (15th Edition)Earth ScienceISBN:9780134543536Author:Edward J. Tarbuck, Frederick K. Lutgens, Dennis G. TasaPublisher:PEARSON
 Environmental Science (MindTap Course List)Earth ScienceISBN:9781337569613Author:G. Tyler Miller, Scott SpoolmanPublisher:Cengage Learning
 Physical GeologyEarth ScienceISBN:9781259916823Author:Plummer, Charles C., CARLSON, Diane H., Hammersley, LisaPublisher:Mcgraw-hill Education,