The map of an idealized tectonic plate and the earthquake hazards associated with each type of plate edge.
Answer to Problem 1QR
The map of an idealized tectonic plate contains three types of plate edges. The divergent motion causes small earthquakes, slide-past motion causes major earthquakes, and the convergent motion causes very large magnitudes of earthquake.
Explanation of Solution
Pictorial representation: Fig.1 represents a map of an idealized tectonic plate.
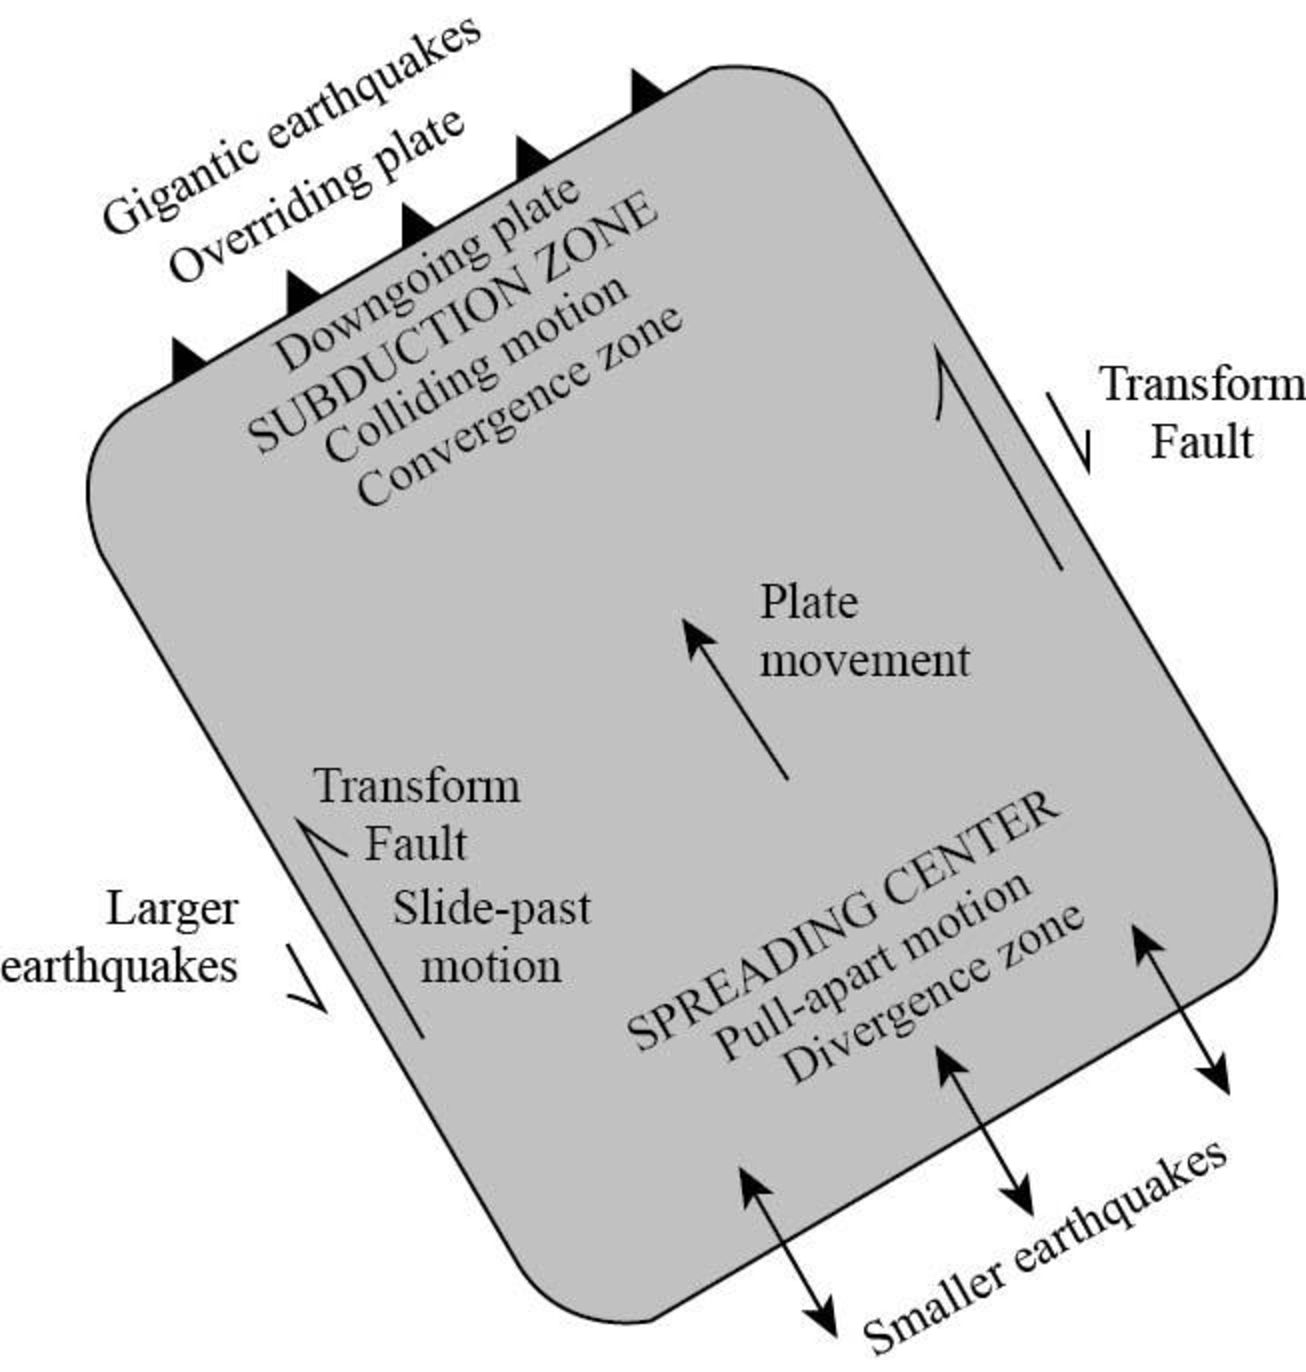
Fig.1: Map of an idealized tectonic plate
An earthquake is defined as a natural event which is caused by the sudden shaking of the surface of the earth. The occurrence of an earthquake is explained by the plate-tectonics theory, in which the lithosphere breaks into rigid plates that move away from, past, and into other rigid plates. This process is seen on the ground as individual faults, where the Earth ruptures and the two sides move past each other in earthquake-generating events.
The earthquake hazards that are associated with each type of plate edge are as follows:
(i) Divergent or pull-apart motion:
The divergent motion of tectonic plates occurs at the spreading centers. It causes the rocks to fail in tension, which results in the easy rupture of the rocks. It results in the yield of many small earthquakes.
(ii) Slide-past motion:
This motion occurs at the curved paths of Earth in the transform faults and causes the plates to slide and shear with each other. It results in causing major earthquakes.
(iii) Convergent or push together motion:
It occurs at the subduction zones and in continent-continent collisions, which causes the rocks to fail in compression. This motion stores immense amount of energy, which is released during very large magnitudes of earthquake.
Want to see more full solutions like this?
Chapter 4 Solutions
Natural Disasters

- Discussion Question: Atmospheric Water & Weather A+ This chapter beautifully focuses on water from the small molecular scale to large-scale weather patterns. The surplus of heat at the equator and the deficit at the Poles drives our atmospheric instability. Instability is a good thing! Without the unstable conditions, there would not be any atmospheric motion. The overheating of the equator pumps atmospheric uplift. As the air rises into lower pressures, it expands and cools... adiabatic cooling! The air migrates north and south and becomes denser than the surrounding air and sinks. The sinking air enters higher pressures and creates the subtropical high pressures and adiabatic heating...whaaaa-la! We have Hadley Cells! Not to mention, the Rainforests and World's largest deserts too! We now can imagine the Hadley cells in three-dimensions. They more or less "sandwich" the equator during the spring and fall equinoxes. However, what happens in the summer and winter? mP Maritime polar…arrow_forwardUsing the map. Solve part e f garrow_forwardAnswer the below questions in detail using the attached pictures. Please ensure it is all 100% done by human, please do not use AI or chatgpt. using the provided hydraulic head data (attached spreadsheet), plot the values at their corresponding piezometer locations (attached piezometer map), contour the head data to create equipotential lines that allow you to demonstrate the groundwater flow direction, indicate the flow direction with arrows, provide comments/observations about the characteristics of the groundwater flow system, for example, are the equipotential lines equally spaced? If not, can you comment on why there are areas with close spacing and other areas with wide spacing? Are there any areas where the aquifer displays artesian conditions? If so, where?arrow_forward
- Please answer the question in detail. Please ensure it is 100% done by human, please do not use AI or chatgpt. Organize your spreadsheets carefully and make sure they are easy to follow. Make sure that your units are consistent, use SI units and make sure your graphs are clear and well labelled.arrow_forwardPlease answer each question in detail. Please ensure it is 100% done by human, please do not use AI or chatgpt.arrow_forwardI need help on this questionarrow_forward
- Please answer the question in detail. Please ensure it is 100% done by human, please do not use AI or chatgpt.arrow_forwardAnswer the below questions in detail using the attached pictures using the provided hydraulic head data (attached spreadsheet), plot the values at their corresponding piezometer locations (attached piezometer map), contour the head data to create equipotential lines that allow you to demonstrate the groundwater flow direction, indicate the flow direction with arrows, provide comments/observations about the characteristics of the groundwater flow system, for example, are the equipotential lines equally spaced? If not, can you comment on why there are areas with close spacing and other areas with wide spacing? Are there any areas where the aquifer displays artesian conditions? If so, where?arrow_forwardPlease answer the three questions in detail and as best as you can. plotting grain-size distribution curves from the grain data provided, calculating D10 values for each sample and using it to estimate the hydraulic conductivity, calculating the porosity for each sample Please ensure it is 100% done by human, please do not use AI or chatgpt.arrow_forward
- Please answer the question in detail. Please ensure it is 100% done by human, please do not use AI or chatgpt.arrow_forwardActivity 9.4 Depositional Features of Glaciers Pg 158Use Figure 9.7, which illustrates a hypothetical retreating glacier, to complete the following. 1. As a glacier retreats, it sometimes stalls and deposits a recessional end moraine. Label the recessional end moraine on Figure 9.7. 2. On Figure 9.7, label an area covered by ground moraine. 3. On Figure 9.7, fill in the appropriate blanks with the names of the following depositional features: kettle lake, kame, drumlin, esker, and outwash plain. 4. Which area is composed of stratified drift: the ground moraine or the outwash plain? Activity 9.5 Depositional Features Associated with Ice Sheets Pgs 159-1611. After examining the map and stereogram, draw a line on the map to outline the area illustrated on the stereogram. 2. What evidence on the map indicates that portions of the area are poorly drained? On what part of the map are these features located? 3. Use Figure 9.11 to draw a topographic profile of the X-Y line on Figure 9.10.…arrow_forward3 1 O O O O Multiple Choice 1 point What is the geodesic distance between Fulton County Airport and the Toledo Express Airport? 27,301.7152 meters 25,923.833 meters 22, 743.621 meters 29,422.61 meters 2 Fill in the Blank 1 point How many airport complexes are in Cuyahoga County? type your answer.... Fill in the Blank 1 point How many airport complexes are in Mahoning County? type your answer... 4 Fill in the Blank 1 point If you lived in Uniopolis, OH, what airport complex would be the closest to you type your answer... two decimal points) type your answer... miles and how far away would it be? (Give this value in miles to -DOarrow_forward
 Applications and Investigations in Earth Science ...Earth ScienceISBN:9780134746241Author:Edward J. Tarbuck, Frederick K. Lutgens, Dennis G. TasaPublisher:PEARSON
 Exercises for Weather & Climate (9th Edition)Earth ScienceISBN:9780134041360Author:Greg CarbonePublisher:PEARSON
 Environmental ScienceEarth ScienceISBN:9781260153125Author:William P Cunningham Prof., Mary Ann Cunningham ProfessorPublisher:McGraw-Hill Education
 Earth Science (15th Edition)Earth ScienceISBN:9780134543536Author:Edward J. Tarbuck, Frederick K. Lutgens, Dennis G. TasaPublisher:PEARSON
 Environmental Science (MindTap Course List)Earth ScienceISBN:9781337569613Author:G. Tyler Miller, Scott SpoolmanPublisher:Cengage Learning
 Physical GeologyEarth ScienceISBN:9781259916823Author:Plummer, Charles C., CARLSON, Diane H., Hammersley, LisaPublisher:Mcgraw-hill Education,