(a)
The dominant alternatives from the given treatments and the reason for them being dominant.
(a)
Explanation of Solution
The dominant treatment option for heart diseases is option F. Although it is the most costly option, it has the highest QALY value as well. Heart disease is something that could be considered will put an individual between life and death. Hence, having to spend more for a longer period of life would be worthwhile. Furthermore, option K could be considered dominant out of various cancer treatments. The cost of the treatment when compared with the QALY value seems reasonable. Due to the nature of the disease, a period of nine years at the respective cost could be considered worthwhile. Option R could be named as dominant under the infectious disease category. As the diseases are infectious spending a higher amount which also has a higher QALY value could be considered prudent.
Introduction:
The table shows the costs that must be borne in relation to various types of treatment for three selected diseases. Together with the costs the QALY figures are also given for each treatment option. A QALY or quality adjusted life year is a measure that takes into account the life expectancy in years together with an element of the quality of life, which is often not considered. The QALY measure ranges from zero which is equal to death to one which is considered perfect health.
(b)
The incremental costs, QALY’s and incremental cost effectiveness ratios for the most prudent treatment options.
(b)
Explanation of Solution
The incremental cost of option C under heart disease is the most rational choice. The incremental cost effectiveness ratio of it being 25 suggests that a patient would live another 33.3 years. This option seems more realistic as well as economically rational. Under the category of cancer, option H is the most rationale. A patient in this category could live another 25 years at an incremental cost of 200. Option O, the most rational choice under infectious diseases provides a patient with another 50 years to live at an incremental cost of 100.
Introduction:
The incremental cost effectiveness ratio is instrumental in providing a systematic means in obtaining certain health standards pertaining to an entire population subject to budgetary constraints. Given that the most effective treatment option is also the least expensive, it would be favorable for policy makers. On the other hand, if the most effective option is also the most expensive, policy makers would be brought into a challenging situation.
(c)
The graphical representation of various diseases.
(c)
Explanation of Solution
The graph for heart disease is as follows;
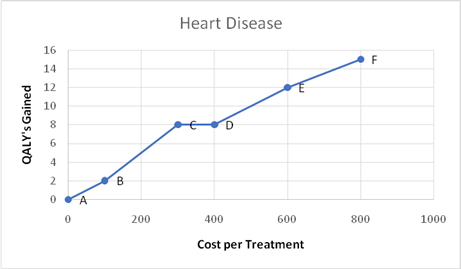
A heart disease being a decisive factor of life of a person is a disease where people opt to spend without hesitation. Hence, treatment option F could be considered a dominant option. Even the cost of it is the highest, so is the QALY value.
The graph for cancer is as follows;
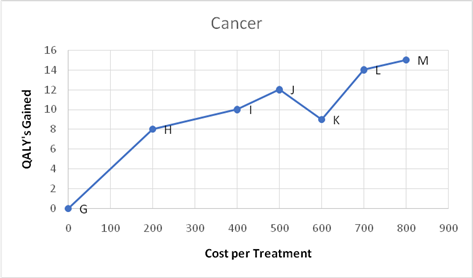
The chance of survival of a cancer patient is considered minimal. Even after receiving the necessary treatment and controlling the spreading of cancer cells, it would still rise even after years. In that note, option K seems prudent, as its cost and the QALY value appears to be realistic.
The graph for infectious diseases is as follows;
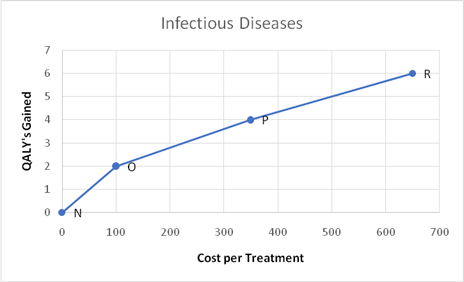
As infectious diseases could create great harm to a society, it is prudent that all necessary measures are taken on a timely manner to prevent them from spreading. Hence, option R could be considered dominant.
Introduction:
To show the two dimensions of cost per treatment and QALYs gained for the three selected diseases, graphs are being used. The vertical axes of the graphs depict the QALY values for each treatment option under each disease. A QALY or a quality adjusted life year is similar to a measure of life expectancy that comes together with a quality element attached. There are instances in life where even the life expectancy is high; the quality of life is poor. The QALY measure has been developed in addressing this issue.
(d)
The best treatment strategy from the standpoint of public health.
(d)
Explanation of Solution
Different professionals as well as patients may carry varying viewpoints on priorities given to various treatment options and illnesses. However, when looked at it from the standpoint of the society at large, it could be said that illnesses that create an impact upon a larger fraction of the society should be given priority. Illnesses such as heart diseases and cancer are undoubtedly wide spread around the globe within the current context. However, they are not contagious diseases and thus the necessary treatment must be obtained at individual level. However, infectious diseases spread much widely at a higher speed. Further, due to their infectiousness, many people would be affected if necessary precautions are not being taken. Hence, option R would be the most prudent strategy. Although the cost of the option is high, amounting to 650, so is the QALY value.
Introduction:
Within any society, there are various types of diseases as well as numerous treatment options. The costs involved with such treatments differ. Together with the costs, the quality component of treatments that would be felt by the patients shall also change. Further, it would be much difficult for public health authorities to correctly identify what disease should be given priority as well as what treatment option should be promoted.
Want to see more full solutions like this?

- How is the mining industry related to other Canadian labour industries? Choose one other industry, (I chose Forestry)and describe how it is related to the mining industry. How do the two industries work together? Do they ever conflict, or do they work well together?arrow_forwardWhat is the primary, secondary, tertiary, and quaternary levels of mining in Canada For each level, describe what types of careers are the most common, and describe what stage your industry’s main resource is in during that stagearrow_forwardHow does the mining industry in canada contribute to the Canadian economy? Describe why your industry is so important to the Canadian economy What would happen if your industry disappeared, or suffered significant layoffs?arrow_forward
- What is already being done to make mining in canada more sustainable? What efforts are being made in order to make mining more sustainable?arrow_forwardWhat are the environmental challenges the canadian mining industry face? Discuss current challenges that mining faces with regard to the environmentarrow_forwardWhat sustainability efforts have been put forth in the mining industry in canada Are your industry’s resources renewable or non-renewable? How do you know? Describe your industry’s reclamation processarrow_forward
- How does oligopolies practice non-price competition in South Africa?arrow_forwardWhat are the advantages and disadvantages of oligopolies on the consumers, businesses and the economy as a whole?arrow_forward1. After the reopening of borders with mainland China following the COVID-19 lockdown, residents living near the border now have the option to shop for food on either side. In Hong Kong, the cost of food is at its listed price, while across the border in mainland China, the price is only half that of Hong Kong's. A recent report indicates a decline in food sales in Hong Kong post-reopening. ** Diagrams need not be to scale; Focus on accurately representing the relevant concepts and relationships rather than the exact proportions. (a) Using a diagram, explain why Hong Kong's food sales might have dropped after the border reopening. Assume that consumers are indifferent between purchasing food in Hong Kong or mainland China, and therefore, their indifference curves have a slope of one like below. Additionally, consider that there are no transport costs and the daily food budget for consumers is identical whether they shop in Hong Kong or mainland China. I 3. 14 (b) In response to the…arrow_forward
- 2. Health Food Company is a well-known global brand that specializes in healthy and organic food products. One of their main products is organic chicken, which they source from small farmers in the area. Health Food Company is the sole buyer of organic chicken in the market. (a) In the context of the organic chicken industry, what type of market structure is Health Food Company operating in? (b) Using a diagram, explain how the identified market structure affects the input pricing and output decisions of Health Food Company. Specifically, include the relevant curves and any key points such as the profit-maximizing price and quantity. () (c) How can encouraging small chicken farmers to form bargaining associations help improve their trade terms? Explain how this works by drawing on the graph in answer (b) to illustrate your answer.arrow_forward2. Suppose that a farmer has two ways to produce his crop. He can use a low-polluting technology with the marginal cost curve MCL or a high polluting technology with the marginal cost curve MCH. If the farmer uses the high-polluting technology, for each unit of quantity produced, one unit of pollution is also produced. Pollution causes pollution damages that are valued at $E per unit. The good produced can be sold in the market for $P per unit. P 1 MCH 0 Q₁ MCL Q2 E a. b. C. If there are no restrictions on the firm's choices, which technology will the farmer use and what quantity will he produce? Explain, referring to the area identified in the figure Given your response in part a, is it socially efficient for there to be no restriction on production? Explain, referring to the area identified in the figure If the government restricts production to Q1, what technology would the farmer choose? Would a socially efficient outcome be achieved? Explain, referring to the area identified in…arrow_forwardI need help in seeing how these are the answers. If you could please write down your steps so I can see how it's done please.arrow_forward


 Economics (MindTap Course List)EconomicsISBN:9781337617383Author:Roger A. ArnoldPublisher:Cengage Learning

 Exploring EconomicsEconomicsISBN:9781544336329Author:Robert L. SextonPublisher:SAGE Publications, Inc