
A
The impact on the cigarette market when the remedy for lung cancer is discovered.
Concept Introduction:
Supply curve: The supply curve is the graphical representation of the relationship between the price of a good or service and the quantity supplied for a given period of time. The X (vertical) axis represents the price and quantity supplied in the Y (horizontal) axis.
A
Explanation of Solution
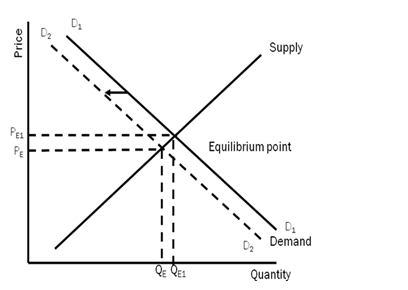
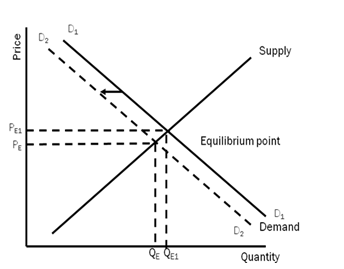
- A cure for lung cancer is found
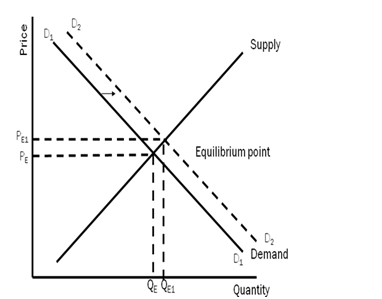
Other things remaining the same, after the cure for lung cancer is found, the fear of getting non-curable cancer in the mind of the smokers will no longer exist. Now they will become fearless and the smoking might increase. The demand for cigarettes will increase. There will be a rightward shift in the demand curve from D1 to D2, supply remaining same at S1.
B
The impact on the cigarette market when there is a rise in the price of cigars.
Concept Introduction:
Demand curve: The demand curve is the graphical representation of the relationship between the price of a good or service and the quantity demanded for a given period of time. The X (vertical) axis represents the price and quantity demanded in the Y (horizontal) axis.
Supply curve: The supply curve is the graphical representation of the relationship between the price of a good or service and the quantity supplied for a given period of time. The X (vertical) axis represents the price and quantity supplied in the Y (horizontal) axis.
B
Explanation of Solution
The price of Cigars increases
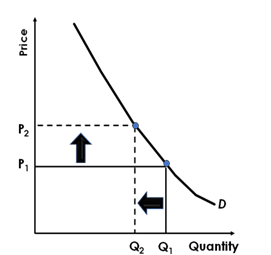
Other things remaining the same, as the price of the cigarette will increase, the demand for the cigarette will decrease as per the demand law. But as the cigarette is all about addiction, the demand is more inelastic. So the demand will fall but at a much lower rate as compared to the price.
C
The impact on the cigarette market when the wages in the tobacco growing states increases.
C
Explanation of Solution
Wages increases substantially in the states that grow tobacco.
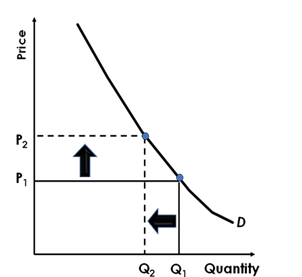
Other things remaining the same, as the wages for growing tobacco has increased, it implies that the cost of production of producing cigarettes has increased. Thus the price of cigarette will increase; the demand for the cigarette will decrease as per the demand law. But as the cigarette is all about addiction, the demand is more inelastic. So the demand will fall but at a much lower rate as compared to the price.
Introduction:
Demand curve: The demand curve is the graphical representation of the relationship between the price of a good or service and the quantity demanded for a given period of time. The X (vertical) axis represents the price and quantity demanded in the Y (horizontal) axis.
Supply curve: The supply curve is the graphical representation of the relationship between the price of a good or service and the quantity supplied for a given period of time. The X (vertical) axis represents the price and quantity supplied in the Y (horizontal) axis.
D
The impact on the cigarette market with the discovery of a fertilizer that increases the yield per acre of tobacco.
D
Explanation of Solution
A fertilizer that increases the yield per acre of tobacco is discovered
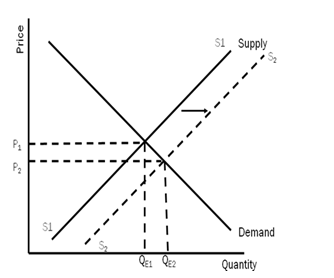
Other things remaining the same, as the fertilizer that increases the yield per acre of tobacco is discovered, it implies that the supply of tobacco will be more, and thus the supply of cigarette will increase. There will be a rightward shift in the supply curve from S1 to S2, supply remaining same at D1.
Introduction:
Demand curve: The demand curve is the graphical representation of the relationship between the price of a good or service and the quantity demanded for a given period of time. The X (vertical) axis represents the price and quantity demanded in the Y (horizontal) axis.
Supply curve: The supply curve is the graphical representation of the relationship between the price of a good or service and the quantity supplied for a given period of time. The X (vertical) axis represents the price and quantity supplied in the Y (horizontal) axis.
E
The impact on the cigarette market with an increase in the prices of lighters, matches and lighter fluid.
E
Explanation of Solution
There is a sharp increase in the price of matches, lighters and lighter fluid
Other things remaining the same, as there is a sharp increase in the price of matches, lighters and lighter fluid, it implies that the demand of cigarette will be less, as the complementary goods price has increased There will be a leftward shift in the demand curve from D1 to D2, supply remaining same at S1.
Introduction:
Demand curve: The demand curve is the graphical representation of the relationship between the price of a good or service and the quantity demanded for a given period of time. The X (vertical) axis represents the price and quantity demanded in the Y (horizontal) axis.
Supply curve: The supply curve is the graphical representation of the relationship between the price of a good or service and the quantity supplied for a given period of time. The X (vertical) axis represents the price and quantity supplied in the Y (horizontal) axis.
F
The impact on the cigarette market when the laws restricting smoking in public places and restaurants have been passed in many states.
F
Explanation of Solution
More states pass laws restricting the smoking in restaurants and public places.
Other things remaining the same, as more states pass laws restricting the smoking in restaurants and public places, implies restriction in smoking. It will lead to decreases in the demand of cigarette. There will be a leftward shift in the demand curve from D1 to D2, supply remaining same at S1.
Introduction:
Demand curve: The demand curve is the graphical representation of the relationship between the price of a good or service and the quantity demanded for a given period of time. The X (vertical) axis represents the price and quantity demanded in the Y (horizontal) axis.
Supply curve: The supply curve is the graphical representation of the relationship between the price of a good or service and the quantity supplied for a given period of time. The X (vertical) axis represents the price and quantity supplied in the Y (horizontal) axis.
Want to see more full solutions like this?

- Can you please help with this one. Some economists argue that taxing consumption is more efficient than taxing income. Following the same argument, the minister of finance of a country introduced a new tax for sugar based products “sugar tax” to promote healthy eating in the economy. Please use relevant diagrams to explain the impact of the tax on consumers, producers and the tax revenue when sugar is elastic and inelastic.arrow_forwardprofit maximizing and loss minamization fire dragon co mindtaparrow_forwardProblem 3 You are given the following demand for European luxury automobiles: Q=1,000 P-0.5.2/1.6 where P-Price of European luxury cars PA = Price of American luxury cars P, Price of Japanese luxury cars I= Annual income of car buyers Assume that each of the coefficients is statistically significant (i.e., that they passed the t-test). On the basis of the information given, answer the following questions 1. Comment on the degree of substitutability between European and American luxury cars and between European and Japanese luxury cars. Explain some possible reasons for the results in the equation. 2. Comment on the coefficient for the income variable. Is this result what you would expect? Explain. 3. Comment on the coefficient of the European car price variable. Is that what you would expect? Explain.arrow_forward
- Problem 2: A manufacturer of computer workstations gathered average monthly sales figures from its 56 branch offices and dealerships across the country and estimated the following demand for its product: Q=+15,000-2.80P+150A+0.3P+0.35Pm+0.2Pc (5,234) (1.29) (175) (0.12) (0.17) (0.13) R²=0.68 SER 786 F=21.25 The variables and their assumed values are P = Price of basic model = 7,000 Q==Quantity A = Advertising expenditures (in thousands) = 52 P = Average price of a personal computer = 4,000 P. Average price of a minicomputer = 15,000 Pe Average price of a leading competitor's workstation = 8,000 1. Compute the elasticities for each variable. On this basis, discuss the relative impact that each variable has on the demand. What implications do these results have for the firm's marketing and pricing policies? 2. Conduct a t-test for the statistical significance of each variable. In each case, state whether a one-tail or two-tail test is required. What difference, if any, does it make to…arrow_forwardYou are the manager of a large automobile dealership who wants to learn more about the effective- ness of various discounts offered to customers over the past 14 months. Following are the average negotiated prices for each month and the quantities sold of a basic model (adjusted for various options) over this period of time. 1. Graph this information on a scatter plot. Estimate the demand equation. What do the regression results indicate about the desirability of discounting the price? Explain. Month Price Quantity Jan. 12,500 15 Feb. 12,200 17 Mar. 11,900 16 Apr. 12,000 18 May 11,800 20 June 12,500 18 July 11,700 22 Aug. 12,100 15 Sept. 11,400 22 Oct. 11,400 25 Nov. 11,200 24 Dec. 11,000 30 Jan. 10,800 25 Feb. 10,000 28 2. What other factors besides price might be included in this equation? Do you foresee any difficulty in obtaining these additional data or incorporating them in the regression analysis?arrow_forwardsimple steps on how it should look like on excelarrow_forward
- Consider options on a stock that does not pay dividends.The stock price is $100 per share, and the risk-free interest rate is 10%.Thestock moves randomly with u=1.25and d=1/u Use Excel to calculate the premium of a10-year call with a strike of $100.arrow_forwardCompute the Fourier sine and cosine transforms of f(x) = e.arrow_forwardDon't use ai to answer I will report you answerarrow_forward
 Microeconomics: Private and Public Choice (MindTa...EconomicsISBN:9781305506893Author:James D. Gwartney, Richard L. Stroup, Russell S. Sobel, David A. MacphersonPublisher:Cengage Learning
 Macroeconomics: Private and Public Choice (MindTa...EconomicsISBN:9781305506756Author:James D. Gwartney, Richard L. Stroup, Russell S. Sobel, David A. MacphersonPublisher:Cengage Learning
 Economics: Private and Public Choice (MindTap Cou...EconomicsISBN:9781305506725Author:James D. Gwartney, Richard L. Stroup, Russell S. Sobel, David A. MacphersonPublisher:Cengage Learning

