
A
The impact on the cigarette market when the remedy for lung cancer is discovered.
Concept Introduction:
Supply curve: The supply curve is the graphical representation of the relationship between the price of a good or service and the quantity supplied for a given period of time. The X (vertical) axis represents the price and quantity supplied in the Y (horizontal) axis.
A
Explanation of Solution
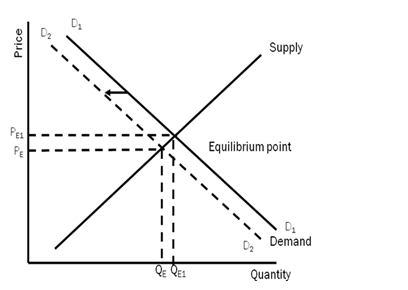
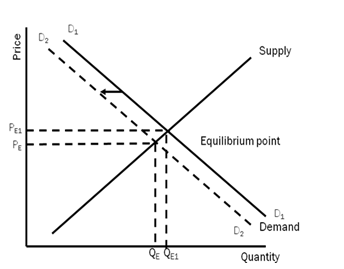
- A cure for lung cancer is found
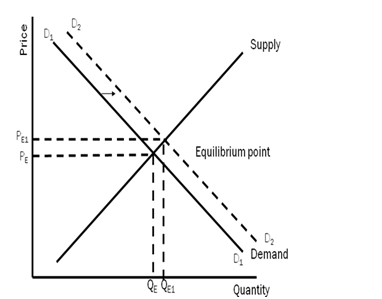
Other things remaining the same, after the cure for lung cancer is found, the fear of getting non-curable cancer in the mind of the smokers will no longer exist. Now they will become fearless and the smoking might increase. The demand for cigarettes will increase. There will be a rightward shift in the demand curve from D1 to D2, supply remaining same at S1.
B
The impact on the cigarette market when there is a rise in the price of cigars.
Concept Introduction:
Demand curve: The demand curve is the graphical representation of the relationship between the price of a good or service and the quantity demanded for a given period of time. The X (vertical) axis represents the price and quantity demanded in the Y (horizontal) axis.
Supply curve: The supply curve is the graphical representation of the relationship between the price of a good or service and the quantity supplied for a given period of time. The X (vertical) axis represents the price and quantity supplied in the Y (horizontal) axis.
B
Explanation of Solution
The price of Cigars increases
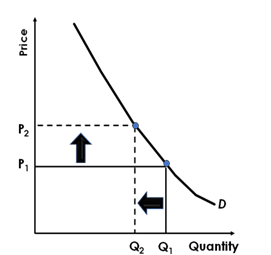
Other things remaining the same, as the price of the cigarette will increase, the demand for the cigarette will decrease as per the demand law. But as the cigarette is all about addiction, the demand is more inelastic. So the demand will fall but at a much lower rate as compared to the price.
C
The impact on the cigarette market when the wages in the tobacco growing states increases.
C
Explanation of Solution
Wages increases substantially in the states that grow tobacco.
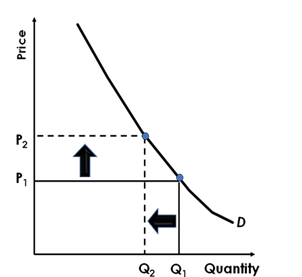
Other things remaining the same, as the wages for growing tobacco has increased, it implies that the cost of production of producing cigarettes has increased. Thus the price of cigarette will increase; the demand for the cigarette will decrease as per the demand law. But as the cigarette is all about addiction, the demand is more inelastic. So the demand will fall but at a much lower rate as compared to the price.
Introduction:
Demand curve: The demand curve is the graphical representation of the relationship between the price of a good or service and the quantity demanded for a given period of time. The X (vertical) axis represents the price and quantity demanded in the Y (horizontal) axis.
Supply curve: The supply curve is the graphical representation of the relationship between the price of a good or service and the quantity supplied for a given period of time. The X (vertical) axis represents the price and quantity supplied in the Y (horizontal) axis.
D
The impact on the cigarette market with the discovery of a fertilizer that increases the yield per acre of tobacco.
D
Explanation of Solution
A fertilizer that increases the yield per acre of tobacco is discovered
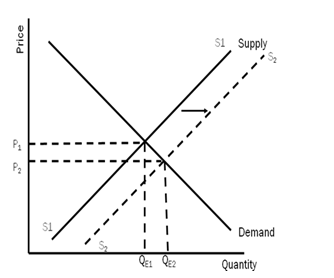
Other things remaining the same, as the fertilizer that increases the yield per acre of tobacco is discovered, it implies that the supply of tobacco will be more, and thus the supply of cigarette will increase. There will be a rightward shift in the supply curve from S1 to S2, supply remaining same at D1.
Introduction:
Demand curve: The demand curve is the graphical representation of the relationship between the price of a good or service and the quantity demanded for a given period of time. The X (vertical) axis represents the price and quantity demanded in the Y (horizontal) axis.
Supply curve: The supply curve is the graphical representation of the relationship between the price of a good or service and the quantity supplied for a given period of time. The X (vertical) axis represents the price and quantity supplied in the Y (horizontal) axis.
E
The impact on the cigarette market with an increase in the prices of lighters, matches and lighter fluid.
E
Explanation of Solution
There is a sharp increase in the price of matches, lighters and lighter fluid
Other things remaining the same, as there is a sharp increase in the price of matches, lighters and lighter fluid, it implies that the demand of cigarette will be less, as the complementary goods price has increased There will be a leftward shift in the demand curve from D1 to D2, supply remaining same at S1.
Introduction:
Demand curve: The demand curve is the graphical representation of the relationship between the price of a good or service and the quantity demanded for a given period of time. The X (vertical) axis represents the price and quantity demanded in the Y (horizontal) axis.
Supply curve: The supply curve is the graphical representation of the relationship between the price of a good or service and the quantity supplied for a given period of time. The X (vertical) axis represents the price and quantity supplied in the Y (horizontal) axis.
F
The impact on the cigarette market when the laws restricting smoking in public places and restaurants have been passed in many states.
F
Explanation of Solution
More states pass laws restricting the smoking in restaurants and public places.
Other things remaining the same, as more states pass laws restricting the smoking in restaurants and public places, implies restriction in smoking. It will lead to decreases in the demand of cigarette. There will be a leftward shift in the demand curve from D1 to D2, supply remaining same at S1.
Introduction:
Demand curve: The demand curve is the graphical representation of the relationship between the price of a good or service and the quantity demanded for a given period of time. The X (vertical) axis represents the price and quantity demanded in the Y (horizontal) axis.
Supply curve: The supply curve is the graphical representation of the relationship between the price of a good or service and the quantity supplied for a given period of time. The X (vertical) axis represents the price and quantity supplied in the Y (horizontal) axis.
Want to see more full solutions like this?
Chapter 4 Solutions
ECON MACRO (with MindTap Printed Access Card) (New, Engaging Titles from 4LTR Press)

- 1. We want to examine the comparative statics of the Black Scholes model. Complete the following table using the Excel model from class or another of your choice. Provide the call premium and the put premium for each scenario. Underlier Risk-free Scenario price rate Volatility Time to expiration Strike Call premium Put premium Baseline $50 5% 25% 1 year $55 Higher strike $50 5% 25% 1 year $60 Higher volatility $50 5% 40% 1 year $55 Higher risk free $50 8% 25% 1 year $55 More time $50 5% 25% 2 years $55 2. Look at the baseline scenario. a. What is the probability that the call is exercised in the baseline scenario? b. What is the probability that the put is exercised? c. Explain why the probabilities sum to 1.arrow_forwardSome people say that since inflation can be reduced in the long run without an increase in unemployment, we should reduce inflation to zero. Others believe that a steady rate of inflation at, say, 3 percent, should be our goal. What are the pros and cons of these two arguments? What, in your opinion, are good long-run goals for reducing inflation and unemployment?arrow_forwardExplain in words how investment multiplier and the interest sensitivity of aggregate demand affect the slope of the IS curve. Explain in words how and why the income and interest sensitivities of the demand for real balances affect the slope of the LM curve. According to the IS–LM model, what happens to the interest rate, income, consumption, and investment under the following circumstances?a. The central bank increases the money supply.b. The government increases government purchases.c. The government increases taxes.arrow_forward
- Suppose that a person’s wealth is $50,000 and that her yearlyincome is $60,000. Also suppose that her money demand functionis given by Md = $Y10.35 - i2Derive the demand for bonds. Suppose the interest rate increases by 10 percentage points. What is the effect on her demand for bonds?b. What are the effects of an increase in income on her demand for money and her demand for bonds? Explain in wordsarrow_forwardImagine you are a world leader and you just viewed this presentation as part of the United Nations Sustainable Development Goal Meeting. Summarize your findings https://www.youtube.com/watch?v=v7WUpgPZzpIarrow_forwardPlease draw a standard Commercial Bank Balance Sheet and briefly explain each of the main components.arrow_forward
- Please draw the Federal Reserve System’s Balance Sheet and briefly explain each of the main components.arrow_forward19. In a paragraph, no bullet, points please answer the question and follow the instructions. Give only the solution: Use the Feynman technique throughout. Assume that you’re explaining the answer to someone who doesn’t know the topic at all. How does the Federal Reserve currently get the federal funds rate where they want it to be?arrow_forward18. In a paragraph, no bullet, points please answer the question and follow the instructions. Give only the solution: Use the Feynman technique throughout. Assume that you’re explaining the answer to someone who doesn’t know the topic at all. Carefully compare and contrast fiscal policy and monetary policy.arrow_forward
- 15. In a paragraph, no bullet, points please answer the question and follow the instructions. Give only the solution: Use the Feynman technique throughout. Assume that you’re explaining the answer to someone who doesn’t know the topic at all. What are the common arguments for and against high levels of federal debt?arrow_forward17. In a paragraph, no bullet, points please answer the question and follow the instructions. Give only the solution: Use the Feynman technique throughout. Assume that you’re explaining the answer to someone who doesn’t know the topic at all. Explain the difference between present value and future value. Be sure to use and explain the mathematical formulas for both. How does one interpret these formulas?arrow_forward12. Give the solution: Use the Feynman technique throughout. Assume that you’re explaining the answer to someone who doesn’t know the topic at all. Show and carefully explain the Taylor rule and all of its components, used as a monetary policy guide.arrow_forward
 Microeconomics: Private and Public Choice (MindTa...EconomicsISBN:9781305506893Author:James D. Gwartney, Richard L. Stroup, Russell S. Sobel, David A. MacphersonPublisher:Cengage Learning
 Macroeconomics: Private and Public Choice (MindTa...EconomicsISBN:9781305506756Author:James D. Gwartney, Richard L. Stroup, Russell S. Sobel, David A. MacphersonPublisher:Cengage Learning
 Economics: Private and Public Choice (MindTap Cou...EconomicsISBN:9781305506725Author:James D. Gwartney, Richard L. Stroup, Russell S. Sobel, David A. MacphersonPublisher:Cengage Learning

