Concept explainers
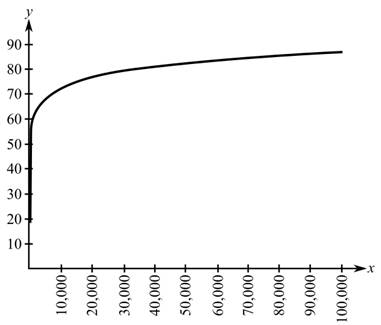
To graph: A graph of the function given from x = 0 to 100,000.
Explanation of Solution
Given:
Per-person income is the x-variable and the life expectancy as the y-variable.
Graph:
For the given function to plot the graph, put the value of x from
Step1: On Ti-83 graphing calculator press Y= and enter the function given.
Step2: Tap on WINDOW button and set the values of range x as Xmin=0 and Xmax=100,000.
Step3: Tap on GRAPH button and observe the graph.
The graph of the function is shown below:

Interpretation:
The shape of the graph is increasing and after some values of
Want to see more full solutions like this?
Chapter 4 Solutions
Mathematics with Applications In the Management, Natural, and Social Sciences Plus NEW MyLab Math with Pearson eText -- Access Card Package (11th Edition)
- To explain how to view "Infinite Series" from "Infinite Sequence"’s perspective, refer to 12.2.1arrow_forwardExplain the key points and reasons for the establishment of 12.2.5 and 12.2.6arrow_forwardPage < 1 of 2 - ZOOM + 1) a) Find a matrix P such that PT AP orthogonally diagonalizes the following matrix A. = [{² 1] A = b) Verify that PT AP gives the correct diagonal form. 2 01 -2 3 2) Given the following matrices A = -1 0 1] an and B = 0 1 -3 2 find the following matrices: a) (AB) b) (BA)T 3) Find the inverse of the following matrix A using Gauss-Jordan elimination or adjoint of the matrix and check the correctness of your answer (Hint: AA¯¹ = I). [1 1 1 A = 3 5 4 L3 6 5 4) Solve the following system of linear equations using any one of Cramer's Rule, Gaussian Elimination, Gauss-Jordan Elimination or Inverse Matrix methods and check the correctness of your answer. 4x-y-z=1 2x + 2y + 3z = 10 5x-2y-2z = -1 5) a) Describe the zero vector and the additive inverse of a vector in the vector space, M3,3. b) Determine if the following set S is a subspace of M3,3 with the standard operations. Show all appropriate supporting work.arrow_forward
- 13) Let U = {j, k, l, m, n, o, p} be the universal set. Let V = {m, o,p), W = {l,o, k}, and X = {j,k). List the elements of the following sets and the cardinal number of each set. a) W° and n(W) b) (VUW) and n((V U W)') c) VUWUX and n(V U W UX) d) vnWnX and n(V WnX)arrow_forward9) Use the Venn Diagram given below to determine the number elements in each of the following sets. a) n(A). b) n(A° UBC). U B oh a k gy ท W z r e t ་ Carrow_forward10) Find n(K) given that n(T) = 7,n(KT) = 5,n(KUT) = 13.arrow_forward
- 7) Use the Venn Diagram below to determine the sets A, B, and U. A = B = U = Blue Orange white Yellow Black Pink Purple green Grey brown Uarrow_forward8. For x>_1, the continuous function g is decreasing and positive. A portion of the graph of g is shown above. For n>_1, the nth term of the series summation from n=1 to infinity a_n is defined by a_n=g(n). If intergral 1 to infinity g(x)dx converges to 8, which of the following could be true? A) summation n=1 to infinity a_n = 6. B) summation n=1 to infinity a_n =8. C) summation n=1 to infinity a_n = 10. D) summation n=1 to infinity a_n diverges.arrow_forward8) Use the Venn diagram provided to shade An Bº. A B U Darrow_forward
- 5) Describe the difference between disjoint sets and overlapping sets.arrow_forward12) Suppose U = {a,b,c,d,e) and A = {a, b, c, e) and B = (c,d,e). Determine (An B).arrow_forward1) Use the roster method to list the elements of the set consisting of: a) All positive multiples of 3 that are less than 20. b) Nothing (An empty set).arrow_forward
 Discrete Mathematics and Its Applications ( 8th I...MathISBN:9781259676512Author:Kenneth H RosenPublisher:McGraw-Hill Education
 Mathematics for Elementary Teachers with Activiti...MathISBN:9780134392790Author:Beckmann, SybillaPublisher:PEARSON
 Thinking Mathematically (7th Edition)MathISBN:9780134683713Author:Robert F. BlitzerPublisher:PEARSON
 Discrete Mathematics With ApplicationsMathISBN:9781337694193Author:EPP, Susanna S.Publisher:Cengage Learning,
 Pathways To Math Literacy (looseleaf)MathISBN:9781259985607Author:David Sobecki Professor, Brian A. MercerPublisher:McGraw-Hill Education


