Concept explainers
Videos
Use Solver to create a Sensitivity Report for question 23 at the end of chapter 3 and answer the following questions:
- a. Is the optimal solution unique? How can you tell?
- b. Which location is receiving the fewest cars?
- c. Suppose a particular car at location 1 must be sent to location 3 in order to meet a customer’s request. How much does this increase costs for the company?
- d. Suppose location 6 must have at least eight cars shipped to it. What impact does this have on the optimal objective function value?
23. The Rent-A-Dent car rental company allows its customers to pick up a rental car at one location and return it to any of its locations. Currently, two locations (1 and 2) have 16 and 18 surplus cars, respectively, and four locations (3, 4, 5, and 6) each need 10 cars. The costs of getting the surplus cars from locations 1 and 2 to the other locations are summarized in the following table.
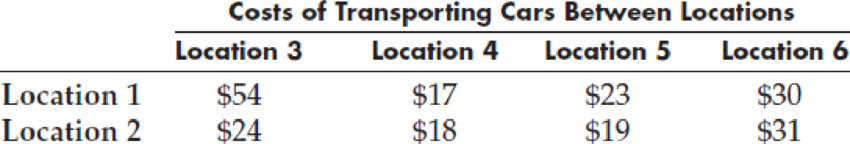
Because 34 surplus cars are available at locations 1 and 2, and 40 cars are needed at locations 3, 4, 5, and 6, some locations will not receive as many cars as they need. However, management wants to make sure that all the surplus cars are sent where they are needed, and that each location needing cars receives at least five.
- a. Formulate an LP model for this problem.
- b. Create a spreadsheet model for this problem and solve it using Solver.
- c. What is the optimal solution?

Trending nowThis is a popular solution!

Chapter 4 Solutions
Spreadsheet Modeling & Decision Analysis: A Practical Introduction to Business Analytics (MindTap Course List)


- my boss is considering transferring a member of the international staff, a Training Manager , from Mexico City to the US office in Chicago. She has asked me to use the requirements listed below and to make a recommendation regarding pay and benefits to be paid. I need to write her a memo outlining the job requirements and make a recommendation as to the pay and benefits the Training and development specialist should receive. Use the link below to obtain the required information in order to address the boss' questions in the memo she has required. http://www.salary.com/category/salary/# Find a job description for a Training Manager who has full department wide authority and who is considered a lower middle level manager. In order to use this site you will need to compare up to three similar positions. Select the "Free Salary Data" box for the job you will be using. This will bring up a salary bell curve. To determine benefits to be offered and their costs, select the "benefits"…arrow_forwardWhat is the difference between exempt and non-exempt jobs?arrow_forwardDEFINE AND GIVE AN EXAMPLE ON HOW TO CONDUCT A JOB EVALUATIONarrow_forward
- 1. Explain with the help of diagram(s) (a) how the producer's and consumer's risks are related to the natural tolerance set at ±30 in a control chart, and (b) how the two risks are involved in the typical OC-curve?arrow_forwardHow the strategies of Faith relate to today's Conducting Business Research from Biblicalarrow_forwardAre there particular Industries that should have labor unions more than others? If so which ones and, of course, why?arrow_forward
- Which position may require an applicant to take a polygraph test? Answers Director of security for a software company Blackjack dealer at a casino Comptroller for an accounting firm Delivery driver for a pharmaceutical firmarrow_forwardAs you are finishing this week’s report to the management team, you will be focused on which approach to use for staffing the new operations. There are four approaches to consider, ethnocentric, polycentric, regiocentric, or global. You will need managers, administrative staff, and plant workers to begin operations. Initial Post Instructions Taking into consideration of the Philippine culture and education levels, which of these four approaches would be the best approach for your expansion plan? You may also select a hybrid approach. Explain your reasons for this selection. What is your top requirement in determining who to hire? For example, is knowledge and ability the most important skill set, or ability to adjust to change, or a growth mindset, or what other area do you believe is essential for the success of the expansion plan?arrow_forwardFor University of wales trinity saint david ,UK- : Comparing with university of the west of scotland and university of south wales , why university of wales trinity saint david is better than other university? focus on international studentarrow_forward
- About this Assignment As organizations grow, particularly in the global space, change is inevitable. As businesses take on a more global facing model, management must be ready to facilitate the changes that ensue. This means creating plans for introducing and managing change. Lewin's 3-Stage Model of Change and Kotter's 8-Step Change Model are widely used to help overcome barriers to change in organizations. Drawing on what you've learned in this course, please choose one of the following prompts and write a 2,000 word (minimum) report to address it. Prompt 1 You are in upper management for a mid-sized manufacturing company. Recent economic changes forced upper management to move much of the manufacturing to a foreign country. As a result, many of the state-side employees will be forced to work directly with foreign counterparts. There is great concern that the existing employees may not embrace the change, and you've been tasked with creating a plan to minimize the fallout. Develop a…arrow_forwardAbout this Assignment Keeping employees motivated is an important element of leadership and organizational behavior. In this course, you've learned about how employee morale is vital to a business's success. In a 2500 to 3000-word essay, research a case study of a company attempting to increase or maintain employee morale. Dissect these examples through the lens of an appropriate motivational theory from the course. Evaluate whether or not the initiative was successful in your opinion, and propose what you might have done differently and why. For example, at one point Linkedin gave each of its employees an iPad mini as a gesture of gratitude for employee contributions to the company. Questions someone could ask about this gesture include the following. What motivational theories apply to this example? What was Linkedin trying to accomplish through this gesture? Do you believe it was successful? Why or why not? What, if anything, would you have done differently and why? Remember to…arrow_forwardAbout this Assignment Keeping employees motivated is an important element of leadership and organizational behavior. In this course, you've learned about how employee morale is vital to a business's success. In a 2500 to 3000-word essay, research a case study of a company attempting to increase or maintain employee morale. Dissect these examples through the lens of an appropriate motivational theory from the course. Evaluate whether or not the initiative was successful in your opinion, and propose what you might have done differently and why. For example, at one point Linkedin gave each of its employees an iPad mini as a gesture of gratitude for employee contributions to the company. Questions someone could ask about this gesture include the following. What motivational theories apply to this example? What was Linkedin trying to accomplish through this gesture? Do you believe it was successful? Why or why not? What, if anything, would you have done differently and why? Remember to…arrow_forward
 Practical Management ScienceOperations ManagementISBN:9781337406659Author:WINSTON, Wayne L.Publisher:Cengage,
 Management, Loose-Leaf VersionManagementISBN:9781305969308Author:Richard L. DaftPublisher:South-Western College Pub