
(a)
Mean and median.
(a)
Explanation of Solution
The mean and median of a woman’s bone density loss is calculated using statistical software and Spreadsheet. The values of mean and median are shown below.
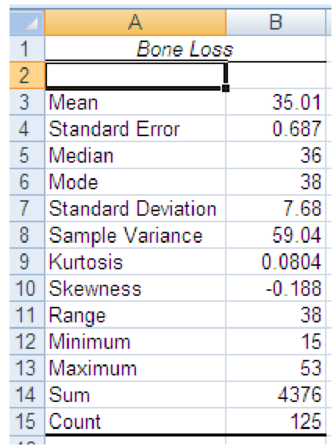
Mean value: 35.01
Median value: 36
Mean: Mean is the average value of the data recorded. That is, it is the sum of the terms (given data) divided by the number of terms.
Median: Median is the mid value of the recorded data.
(b)
Standard deviation.
(b)
Explanation of Solution
Standard deviation of the bone density losses is 7.68. Spreadsheet is shown in part (a).
Standard deviation: Standard deviation can be defined as the amount of variation of a set of data or values.
(b)
Interpretation of the data.
(b)
Explanation of Solution
The values in the spreadsheet show that born density losses lie below 36.
Want to see more full solutions like this?
Chapter 4 Solutions
EBK STATISTICS FOR MANAGEMENT AND ECONO

- Answerarrow_forwardM” method Given the following model, solve by the method of “M”. (see image)arrow_forwardAs indicated in the attached image, U.S. earnings for high- and low-skill workers as measured by educational attainment began diverging in the 1980s. The remaining questions in this problem set use the model for the labor market developed in class to walk through potential explanations for this trend. 1. Assume that there are just two types of workers, low- and high-skill. As a result, there are two labor markets: supply and demand for low-skill workers and supply and demand for high-skill workers. Using two carefully drawn labor-market figures, show that an increase in the demand for high skill workers can explain an increase in the relative wage of high-skill workers. 2. Using the same assumptions as in the previous question, use two carefully drawn labor-market figures to show that an increase in the supply of low-skill workers can explain an increase in the relative wage of high-skill workers.arrow_forward
- Published in 1980, the book Free to Choose discusses how economists Milton Friedman and Rose Friedman proposed a one-sided view of the benefits of a voucher system. However, there are other economists who disagree about the potential effects of a voucher system.arrow_forwardThe following diagram illustrates the demand and marginal revenue curves facing a monopoly in an industry with no economies or diseconomies of scale. In the short and long run, MC = ATC. a. Calculate the values of profit, consumer surplus, and deadweight loss, and illustrate these on the graph. b. Repeat the calculations in part a, but now assume the monopoly is able to practice perfect price discrimination.arrow_forwardThe projects under the 'Build, Build, Build' program: how these projects improve connectivity and ease of doing business in the Philippines?arrow_forward

 Managerial Economics: Applications, Strategies an...EconomicsISBN:9781305506381Author:James R. McGuigan, R. Charles Moyer, Frederick H.deB. HarrisPublisher:Cengage Learning
 Managerial Economics: A Problem Solving ApproachEconomicsISBN:9781337106665Author:Luke M. Froeb, Brian T. McCann, Michael R. Ward, Mike ShorPublisher:Cengage Learning

