
A
The impact on the cigarette market when the remedy for lung cancer is discovered.
Concept Introduction:
Supply curve: The supply curve is the graphical representation of the relationship between the price of a good or service and the quantity supplied for a given period of time. The X (vertical) axis represents the price and quantity supplied in the Y (horizontal) axis.
A
Explanation of Solution
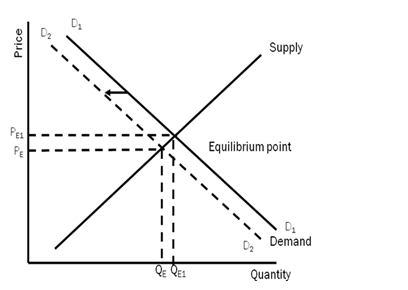
- A cure for lung cancer is found
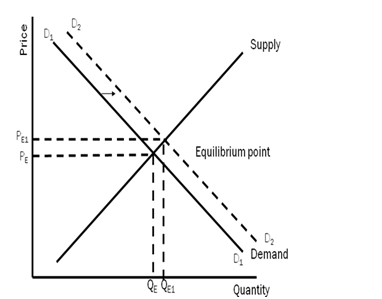
Other things remaining the same, after the cure for lung cancer is found, the fear of getting non-curable cancer in the mind of the smokers will no longer exist. Now they will become fearless and the smoking might increase. The demand for cigarettes will increase. There will be a rightward shift in the demand curve from D1 to D2, supply remaining same at S1.
B
The impact on the cigarette market when there is a rise in the price of cigars.
Concept Introduction:
Demand curve: The demand curve is the graphical representation of the relationship between the price of a good or service and the quantity demanded for a given period of time. The X (vertical) axis represents the price and quantity demanded in the Y (horizontal) axis.
Supply curve: The supply curve is the graphical representation of the relationship between the price of a good or service and the quantity supplied for a given period of time. The X (vertical) axis represents the price and quantity supplied in the Y (horizontal) axis.
B
Explanation of Solution
The price of Cigars increases
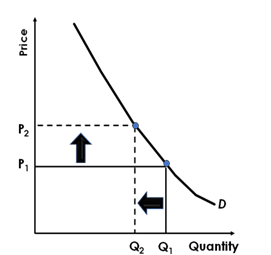
Other things remaining the same, as the price of the cigarette will increase, the demand for the cigarette will decrease as per the demand law. But as the cigarette is all about addiction, the demand is more inelastic. So the demand will fall but at a much lower rate as compared to the price.
C
The impact on the cigarette market when the wages in the tobacco growing states increases.
C
Explanation of Solution
Wages increases substantially in the states that grow tobacco.
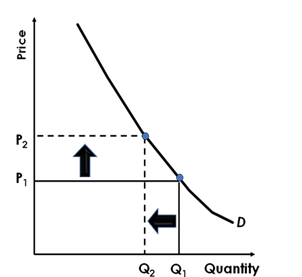
Other things remaining the same, as the wages for growing tobacco has increased, it implies that the cost of production of producing cigarettes has increased. Thus the price of cigarette will increase; the demand for the cigarette will decrease as per the demand law. But as the cigarette is all about addiction, the demand is more inelastic. So the demand will fall but at a much lower rate as compared to the price.
Introduction:
Demand curve: The demand curve is the graphical representation of the relationship between the price of a good or service and the quantity demanded for a given period of time. The X (vertical) axis represents the price and quantity demanded in the Y (horizontal) axis.
Supply curve: The supply curve is the graphical representation of the relationship between the price of a good or service and the quantity supplied for a given period of time. The X (vertical) axis represents the price and quantity supplied in the Y (horizontal) axis.
D
The impact on the cigarette market with the discovery of a fertilizer that increases the yield per acre of tobacco.
D
Explanation of Solution
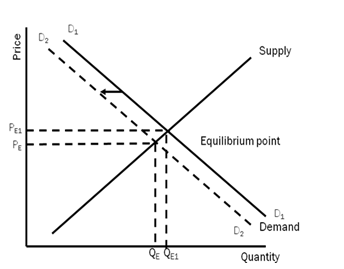
A fertilizer that increases the yield per acre of tobacco is discovered
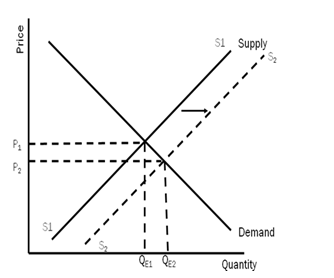
Other things remaining the same, as the fertilizer that increases the yield per acre of tobacco is discovered, it implies that the supply of tobacco will be more, and thus the supply of cigarette will increase. There will be a rightward shift in the supply curve from S1 to S2, supply remaining same at D1.
Introduction:
Demand curve: The demand curve is the graphical representation of the relationship between the price of a good or service and the quantity demanded for a given period of time. The X (vertical) axis represents the price and quantity demanded in the Y (horizontal) axis.
Supply curve: The supply curve is the graphical representation of the relationship between the price of a good or service and the quantity supplied for a given period of time. The X (vertical) axis represents the price and quantity supplied in the Y (horizontal) axis.
E
The impact on the cigarette market with an increase in the prices of lighters, matches and lighter fluid.
E
Explanation of Solution
There is a sharp increase in the price of matches, lighters and lighter fluid
Other things remaining the same, as there is a sharp increase in the price of matches, lighters and lighter fluid, it implies that the demand of cigarette will be less, as the complementary goods price has increased There will be a leftward shift in the demand curve from D1 to D2, supply remaining same at S1.
Introduction:
Demand curve: The demand curve is the graphical representation of the relationship between the price of a good or service and the quantity demanded for a given period of time. The X (vertical) axis represents the price and quantity demanded in the Y (horizontal) axis.
Supply curve: The supply curve is the graphical representation of the relationship between the price of a good or service and the quantity supplied for a given period of time. The X (vertical) axis represents the price and quantity supplied in the Y (horizontal) axis.
F
The impact on the cigarette market when the laws restricting smoking in public places and restaurants have been passed in many states.
F
Explanation of Solution
More states pass laws restricting the smoking in restaurants and public places.
Other things remaining the same, as more states pass laws restricting the smoking in restaurants and public places, implies restriction in smoking. It will lead to decreases in the demand of cigarette. There will be a leftward shift in the demand curve from D1 to D2, supply remaining same at S1.
Introduction:
Demand curve: The demand curve is the graphical representation of the relationship between the price of a good or service and the quantity demanded for a given period of time. The X (vertical) axis represents the price and quantity demanded in the Y (horizontal) axis.
Supply curve: The supply curve is the graphical representation of the relationship between the price of a good or service and the quantity supplied for a given period of time. The X (vertical) axis represents the price and quantity supplied in the Y (horizontal) axis.
Want to see more full solutions like this?

- 20. Factors 01 pro B. the technological innovations available to companies. A. the laws that regulate manufacturers. C. the resources used to create output D. the waste left over after goods are produced. 21. Table 1.1 shows the tradeoff between different combinations of missile production and home construction, ceteris paribus. Complete the table by calculating the required opportunity costs for both missiles and houses. Then answer the indicated question(s). Combination Number of houses Opportunity cost of houses in Number of missiles terms of missiles J 0 4 K 10,000 3 L 17,000 2 1 M 21,000 0 N 23,000 Opportunity cost of missiles in terms of houses Tutorials-Principles of Economics m health carearrow_forwardIn a small open economy with a floating exchange rate, the supply of real money balances is fixed and a rise in government spending ______ Group of answer choices Raises the interest rate so that net exports must fall to maintain equilibrium in the goods market. Cannot change the interest rate so that net exports must fall to maintain equilibrium in the goods market. Cannot change the interest rate so income must rise to maintain equilibrium in the money market Raises the interest rate, so that income must rise to maintain equilibrium in the money market.arrow_forwardSuppose a country with a fixed exchange rate decides to implement a devaluation of its currency and commits to maintaining the new fixed parity. This implies (A) ______________ in the demand for its goods and a monetary (B) _______________. Group of answer choices (A) expansion ; (B) contraction (A) contraction ; (B) expansion (A) expansion ; (B) expansion (A) contraction ; (B) contractionarrow_forward
- Assume a small open country under fixed exchanges rate and full capital mobility. Prices are fixed in the short run and equilibrium is given initially at point A. An exogenous increase in public spending shifts the IS curve to IS'. Which of the following statements is true? Group of answer choices A new equilibrium is reached at point B. The TR curve will shift down until it passes through point B. A new equilibrium is reached at point C. Point B can only be reached in the absence of capital mobility.arrow_forwardA decrease in money demand causes the real interest rate to _____ and output to _____ in the short run, before prices adjust to restore equilibrium. Group of answer choices rise; rise fall; fall fall; rise rise; fallarrow_forwardIf a country's policy makers were to continously use expansionary monetary policy in an attempt to hold unemployment below the natural rate , the long urn result would be? Group of answer choices a decrease in the unemployment rate an increase in the level of output All of these an increase in the rate of inflationarrow_forward
- A shift in the Aggregate Supply curve to the right will result in a move to a point that is southwest of where the economy is currently at. Group of answer choices True Falsearrow_forwardAn oil shock can cause stagflation, a period of higher inflation and higher unemployment. When this happens, the economy moves to a point to the northeast of where it currently is. After the economy has moved to the northeast, the Federal Reserve can reduce that inflation without having to worry about causing more unemployment. Group of answer choices True Falsearrow_forwardThe long-run Phillips Curve is vertical which indicates Group of answer choices that in the long-run, there is no tradeoff between inflation and unemployment. that in the long-run, there is no tradeoff between inflation and the price level. None of these that in the long-run, the economy returns to a 4 percent level of inflation.arrow_forward
- Suppose the exchange rate between the British pound and the U.S. dollar is £1 = $2.00. The U.S. government implementsU.S. government implements a contractionary fiscal policya contractionary fiscal policy. Illustrate the impact of this change in the market for pounds. 1.) Using the line drawing tool, draw and label a new demand line. 2.) Using the line drawing tool, draw and label a new supply line. Note: Carefully follow the instructions above and only draw the required objects.arrow_forwardJust Part D please, this is for environmental economicsarrow_forward3. Consider a single firm that manufactures chemicals and generates pollution through its emissions E. Researchers have estimated the MDF and MAC curves for the emissions to be the following: MDF = 4E and MAC = 125 – E Policymakers have decided to implement an emissions tax to control pollution. They are aware that a constant per-unit tax of $100 is an efficient policy. Yet they are also aware that this policy is not politically feasible because of the large tax burden it places on the firm. As a result, policymakers propose a two- part tax: a per unit tax of $75 for the first 15 units of emissions an increase in the per unit tax to $100 for all further units of emissions With an emissions tax, what is the general condition that determines how much pollution the regulated party will emit? What is the efficient level of emissions given the above MDF and MAC curves? What are the firm's total tax payments under the constant $100 per-unit tax? What is the firm's total cost of compliance…arrow_forward
 Microeconomics: Private and Public Choice (MindTa...EconomicsISBN:9781305506893Author:James D. Gwartney, Richard L. Stroup, Russell S. Sobel, David A. MacphersonPublisher:Cengage Learning
 Macroeconomics: Private and Public Choice (MindTa...EconomicsISBN:9781305506756Author:James D. Gwartney, Richard L. Stroup, Russell S. Sobel, David A. MacphersonPublisher:Cengage Learning
 Economics: Private and Public Choice (MindTap Cou...EconomicsISBN:9781305506725Author:James D. Gwartney, Richard L. Stroup, Russell S. Sobel, David A. MacphersonPublisher:Cengage Learning

