
A
The impact on the cigarette market when the remedy for lung cancer is discovered.
Concept Introduction:
Supply curve: The supply curve is the graphical representation of the relationship between the price of a good or service and the quantity supplied for a given period of time. The X (vertical) axis represents the price and quantity supplied in the Y (horizontal) axis.
A
Explanation of Solution
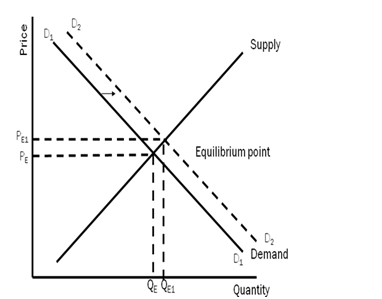
- A cure for lung cancer is found
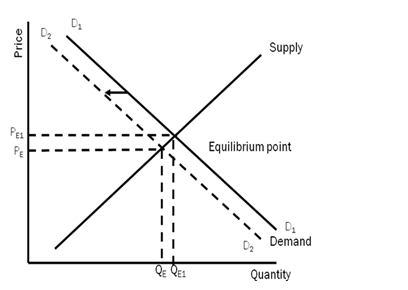
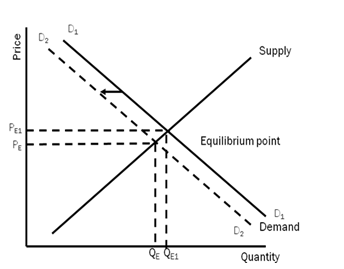
Other things remaining the same, after the cure for lung cancer is found, the fear of getting non-curable cancer in the mind of the smokers will no longer exist. Now they will become fearless and the smoking might increase. The demand for cigarettes will increase. There will be a rightward shift in the demand curve from D1 to D2, supply remaining same at S1.
B
The impact on the cigarette market when there is a rise in the price of cigars.
Concept Introduction:
Demand curve: The demand curve is the graphical representation of the relationship between the price of a good or service and the quantity demanded for a given period of time. The X (vertical) axis represents the price and quantity demanded in the Y (horizontal) axis.
Supply curve: The supply curve is the graphical representation of the relationship between the price of a good or service and the quantity supplied for a given period of time. The X (vertical) axis represents the price and quantity supplied in the Y (horizontal) axis.
B
Explanation of Solution
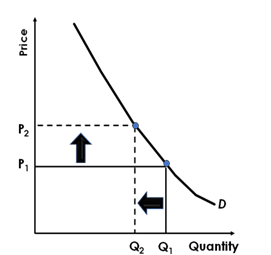
The price of Cigars increases
Other things remaining the same, as the price of the cigarette will increase, the demand for the cigarette will decrease as per the demand law. But as the cigarette is all about addiction, the demand is more inelastic. So the demand will fall but at a much lower rate as compared to the price.
C
The impact on the cigarette market when the wages in the tobacco growing states increases.
C
Explanation of Solution
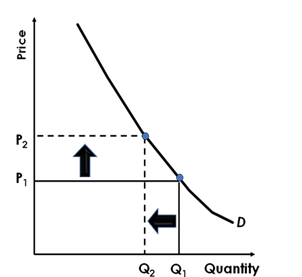
Wages increases substantially in the states that grow tobacco.
Other things remaining the same, as the wages for growing tobacco has increased, it implies that the cost of production of producing cigarettes has increased. Thus the price of cigarette will increase; the demand for the cigarette will decrease as per the demand law. But as the cigarette is all about addiction, the demand is more inelastic. So the demand will fall but at a much lower rate as compared to the price.
Introduction:
Demand curve: The demand curve is the graphical representation of the relationship between the price of a good or service and the quantity demanded for a given period of time. The X (vertical) axis represents the price and quantity demanded in the Y (horizontal) axis.
Supply curve: The supply curve is the graphical representation of the relationship between the price of a good or service and the quantity supplied for a given period of time. The X (vertical) axis represents the price and quantity supplied in the Y (horizontal) axis.
D
The impact on the cigarette market with the discovery of a fertilizer that increases the yield per acre of tobacco.
D
Explanation of Solution
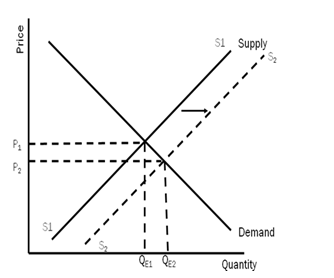
A fertilizer that increases the yield per acre of tobacco is discovered
Other things remaining the same, as the fertilizer that increases the yield per acre of tobacco is discovered, it implies that the supply of tobacco will be more, and thus the supply of cigarette will increase. There will be a rightward shift in the supply curve from S1 to S2, supply remaining same at D1.
Introduction:
Demand curve: The demand curve is the graphical representation of the relationship between the price of a good or service and the quantity demanded for a given period of time. The X (vertical) axis represents the price and quantity demanded in the Y (horizontal) axis.
Supply curve: The supply curve is the graphical representation of the relationship between the price of a good or service and the quantity supplied for a given period of time. The X (vertical) axis represents the price and quantity supplied in the Y (horizontal) axis.
E
The impact on the cigarette market with an increase in the prices of lighters, matches and lighter fluid.
E
Explanation of Solution
There is a sharp increase in the price of matches, lighters and lighter fluid
Other things remaining the same, as there is a sharp increase in the price of matches, lighters and lighter fluid, it implies that the demand of cigarette will be less, as the complementary goods price has increased There will be a leftward shift in the demand curve from D1 to D2, supply remaining same at S1.
Introduction:
Demand curve: The demand curve is the graphical representation of the relationship between the price of a good or service and the quantity demanded for a given period of time. The X (vertical) axis represents the price and quantity demanded in the Y (horizontal) axis.
Supply curve: The supply curve is the graphical representation of the relationship between the price of a good or service and the quantity supplied for a given period of time. The X (vertical) axis represents the price and quantity supplied in the Y (horizontal) axis.
F
The impact on the cigarette market when the laws restricting smoking in public places and restaurants have been passed in many states.
F
Explanation of Solution
More states pass laws restricting the smoking in restaurants and public places.
Other things remaining the same, as more states pass laws restricting the smoking in restaurants and public places, implies restriction in smoking. It will lead to decreases in the demand of cigarette. There will be a leftward shift in the demand curve from D1 to D2, supply remaining same at S1.
Introduction:
Demand curve: The demand curve is the graphical representation of the relationship between the price of a good or service and the quantity demanded for a given period of time. The X (vertical) axis represents the price and quantity demanded in the Y (horizontal) axis.
Supply curve: The supply curve is the graphical representation of the relationship between the price of a good or service and the quantity supplied for a given period of time. The X (vertical) axis represents the price and quantity supplied in the Y (horizontal) axis.
Want to see more full solutions like this?

- Test Preparation QUESTION 2 [20] 2.1 Body Mass Index (BMI) is a summary measure of relative health. It is calculated by dividing an individual's weight (in kilograms) by the square of their height (in meters). A small sample was drawn from the population of UWC students to determine the effect of exercise on BMI score. Given the following table, find the constant and slope parameters of the sample regression function of BMI = f(Weekly exercise hours). Interpret the two estimated parameter values. X (Weekly exercise hours) Y (Body-Mass index) QUESTION 3 2 4 6 8 10 12 41 38 33 27 23 19 Derek investigates the relationship between the days (per year) absent from work (ABSENT) and the number of years taken for the worker to be promoted (PROMOTION). He interviewed a sample of 22 employees in Cape Town to obtain information on ABSENT (X) and PROMOTION (Y), and derived the following: ΣΧ ΣΥ 341 ΣΧΥ 176 ΣΧ 1187 1012 3.1 By using the OLS method, prove that the constant and slope parameters of the…arrow_forwardQUESTION 2 2.1 [30] Mariana, a researcher at the World Health Organisation (WHO), collects information on weekly study hours (HOURS) and blood pressure level when writing a test (BLOOD) from a sample of university students across the country, before running the regression BLOOD = f(STUDY). She collects data from 5 students as listed below: X (STUDY) 2 Y (BLOOD) 4 6 8 10 141 138 133 127 123 2.1.1 By using the OLS method and the information above derive the values for parameters B1 and B2. 2.1.2 Derive the RSS (sum of squares for the residuals). 2.1.3 Hence, calculate ô 2.2 2.3 (6) (3) Further, she replicates her study and collects data from 122 students from a rival university. She derives the residuals followed by computing skewness (S) equals -1.25 and kurtosis (K) equals 8.25 for the rival university data. Conduct the Jacque-Bera test of normality at a = 0.05. (5) Upon tasked with deriving estimates of ẞ1, B2, 82 and the standard errors (SE) of ẞ1 and B₂ for the replicated data.…arrow_forwardIf you were put in charge of ensuring that the mining industry in canada becomes more sustainable over the course of the next decade (2025-2035), how would you approach this? Come up with (at least) one resolution for each of the 4 major types of conflict: social, environmental, economic, and politicalarrow_forward
- How is the mining industry related to other Canadian labour industries? Choose one other industry, (I chose Forestry)and describe how it is related to the mining industry. How do the two industries work together? Do they ever conflict, or do they work well together?arrow_forwardWhat is the primary, secondary, tertiary, and quaternary levels of mining in Canada For each level, describe what types of careers are the most common, and describe what stage your industry’s main resource is in during that stagearrow_forwardHow does the mining industry in canada contribute to the Canadian economy? Describe why your industry is so important to the Canadian economy What would happen if your industry disappeared, or suffered significant layoffs?arrow_forward
- What is already being done to make mining in canada more sustainable? What efforts are being made in order to make mining more sustainable?arrow_forwardWhat are the environmental challenges the canadian mining industry face? Discuss current challenges that mining faces with regard to the environmentarrow_forwardWhat sustainability efforts have been put forth in the mining industry in canada Are your industry’s resources renewable or non-renewable? How do you know? Describe your industry’s reclamation processarrow_forward
- How does oligopolies practice non-price competition in South Africa?arrow_forwardWhat are the advantages and disadvantages of oligopolies on the consumers, businesses and the economy as a whole?arrow_forward1. After the reopening of borders with mainland China following the COVID-19 lockdown, residents living near the border now have the option to shop for food on either side. In Hong Kong, the cost of food is at its listed price, while across the border in mainland China, the price is only half that of Hong Kong's. A recent report indicates a decline in food sales in Hong Kong post-reopening. ** Diagrams need not be to scale; Focus on accurately representing the relevant concepts and relationships rather than the exact proportions. (a) Using a diagram, explain why Hong Kong's food sales might have dropped after the border reopening. Assume that consumers are indifferent between purchasing food in Hong Kong or mainland China, and therefore, their indifference curves have a slope of one like below. Additionally, consider that there are no transport costs and the daily food budget for consumers is identical whether they shop in Hong Kong or mainland China. I 3. 14 (b) In response to the…arrow_forward
 Microeconomics: Private and Public Choice (MindTa...EconomicsISBN:9781305506893Author:James D. Gwartney, Richard L. Stroup, Russell S. Sobel, David A. MacphersonPublisher:Cengage Learning
 Macroeconomics: Private and Public Choice (MindTa...EconomicsISBN:9781305506756Author:James D. Gwartney, Richard L. Stroup, Russell S. Sobel, David A. MacphersonPublisher:Cengage Learning
 Economics: Private and Public Choice (MindTap Cou...EconomicsISBN:9781305506725Author:James D. Gwartney, Richard L. Stroup, Russell S. Sobel, David A. MacphersonPublisher:Cengage Learning

