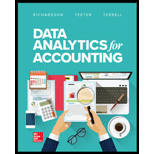
Data Analytics For Accounting
19th Edition
ISBN: 9781260375190
Author: RICHARDSON, Vernon J., Teeter, Ryan, Terrell, Katie
Publisher: Mcgraw-hill Education,
expand_more
expand_more
format_list_bulleted
Question
Chapter 4, Problem 10MCQ
To determine
Identify the chart which is most appropriate chart while showing a relationship between two variables.
Expert Solution & Answer
Want to see the full answer?
Check out a sample textbook solution
Students have asked these similar questions
Company X sets price equal to cost plus 60%. Recently , Company X charged a customer a price of $42 for an item. What was the cost of the item to Company X?
None
What was the cost of the item to company X?
Chapter 4 Solutions
Data Analytics For Accounting
Ch. 4 - Prob. 1MCQCh. 4 - In the late 1960s, Ed Altman developed a model to...Ch. 4 - Justin Zobel suggests that revising your writing...Ch. 4 - Prob. 4MCQCh. 4 - The Fahrenheit scale of temperature measurement...Ch. 4 - _______ data would be considered the least...Ch. 4 - ________ data would be considered the most...Ch. 4 - Prob. 8MCQCh. 4 - Exhibit 4-8 gives chart suggestions for what data...Ch. 4 - Prob. 10MCQ
Ch. 4 - Prob. 1DQCh. 4 - Prob. 2DQCh. 4 - Prob. 3DQCh. 4 - Prob. 4DQCh. 4 - Prob. 5DQCh. 4 - Based on the data from datavizcatalogue.com, how...Ch. 4 - Prob. 7DQCh. 4 - Prob. 8DQCh. 4 - Prob. 9DQCh. 4 - Prob. 1PCh. 4 - Prob. 2PCh. 4 - Prob. 3PCh. 4 - According to Exhibit 4-8, which is the best chart...Ch. 4 - Prob. 5PCh. 4 - Prob. 6PCh. 4 - Prob. 7P
Knowledge Booster
Similar questions
- Noyan Carter's weekly gross earnings for the week ending August 15th were $3,200, and his federal income tax withholding was $650. Assuming the Social Security rate is 6.2% and Medicare is 1.5% of all earnings, What is Carter's net pay?arrow_forwardSuppose that Cullumber Automated Retail Company has the following inventory data: Nov. 1 Inventory 23 units @ $4.70 each 8 Purchase 94 units @ $5.05 each 17 Purchase 47 units @ $4.90 each 25 Purchase 70 units @ $5.10 each The company uses a periodic inventory system. A physical count of merchandise inventory on November 30 reveals that there are 78 units on hand. Cost of goods sold under LIFO rounded to the nearest dollar is $386. $396. $784. $774.arrow_forwardOn May 1, Sandhill Company had beginning inventory consisting of 360 units with a unit cost of $8. During May, the company purchased inventory as follows: 720 units at $8 1080 units at $9 The company sold 1800 units during the month for $14 per unit. Sandhill uses the average-cost method. Assuming that a periodic inventory system is used, the value of Sandhill's inventory at May 31 is (Round average cost per unit to 2 decimal places, e.g. 12.52.) ○ $3240 ○ $18360 ○ $3060 ○ $2880arrow_forward
- Suppose that Sandhill Trading Post has the following inventory data: July 1 Beginning inventory 46 units at $23 $1058 7 Purchases 162 units at $24 3888 22 Purchases 23 units at $26 598 $5544 The company uses a periodic inventory system. A physical count of merchandise inventory on July 31 reveals that there are 58 units on hand. Using the LIFO inventory method, the amount allocated to cost of goods sold for July is ○ $4198. ○ $4036. ○ $3932. ○ $4106.arrow_forwardSuppose that Sandhill Trading Post has the following inventory data: July 1 Beginning inventory 46 units at $23 $1058 7 Purchases 162 units at $24 3888 22 Purchases 23 units at $26 598 $5544 The company uses a periodic inventory system. A physical count of merchandise inventory on July 31 reveals that there are 58 units on hand. Using the LIFO inventory method, the amount allocated to cost of goods sold for July is ○ $4198. ○ $4036. ○ $3932. ○ $4106.arrow_forwardSuppose that Ivanhoe Depot Inc. has the following inventory data: July 1 Beginning inventory 24 units at $19 $456 7 Purchases 84 units at $20 1680 22 Purchases 12 units at $22 264 $2400 The company uses a periodic inventory system. A physical count of merchandise inventory on July 31 reveals that there are 40 units on hand. Using the FIFO inventory method, the amount allocated to ending inventory for July is ○ $824. 000 $800. ○ $880. ○ $776.arrow_forward
arrow_back_ios
SEE MORE QUESTIONS
arrow_forward_ios
Recommended textbooks for you
 Managerial AccountingAccountingISBN:9781337912020Author:Carl Warren, Ph.d. Cma William B. TaylerPublisher:South-Western College Pub
 Financial And Managerial AccountingAccountingISBN:9781337902663Author:WARREN, Carl S.Publisher:Cengage Learning,
 Principles of Cost AccountingAccountingISBN:9781305087408Author:Edward J. Vanderbeck, Maria R. MitchellPublisher:Cengage Learning

Managerial Accounting
Accounting
ISBN:9781337912020
Author:Carl Warren, Ph.d. Cma William B. Tayler
Publisher:South-Western College Pub

Financial And Managerial Accounting
Accounting
ISBN:9781337902663
Author:WARREN, Carl S.
Publisher:Cengage Learning,


Principles of Cost Accounting
Accounting
ISBN:9781305087408
Author:Edward J. Vanderbeck, Maria R. Mitchell
Publisher:Cengage Learning