
Concept explainers
Videos
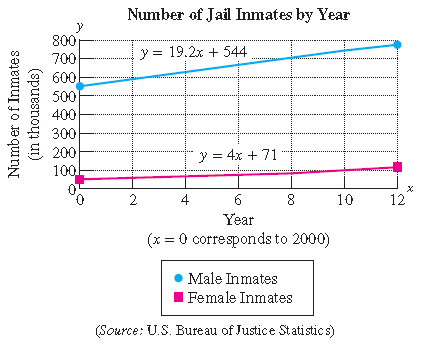
The graph depicts the rise in the number of jail inmates in the United States since 2000. Two linear equations are given: one to describe the number of female inmates and one to describe the number of male inmates by year.
Let y represent the number of inmates (in thousands).
Let x represent the number of years since 2000.
a.What is the slope of the line representing the number of female inmates? Interpret the meaning of the slope in the context of this problem.
b.What is the slope of the line representing the number of male inmates? Interpret the meaning of the slope in the context of this problem.
c.Which group, males or females, has the larger slope? What does this imply about the rise in the number of male and female prisoners?
d.Assuming this trend continues, use the equation to predict the number of female inmates in
Want to see the full answer?
Check out a sample textbook solution
Chapter 3 Solutions
LC BEG & INT ALGEBRA


- Please Help me answer this linear algebra question. This is a practice textbook question.arrow_forwardPlease Help me answer this linear algebra question. This is a practice textbook question.arrow_forwardTY D om E h om ng 00 C B A G F Q ו 3 13 Details Find an Euler path for the graph. Enter your response as a sequence of vertices in the order they are visited, for example, ABCDEA. fic ► Question Help: Video Message instructor Submit Question tor arch 園 A Wind advisoryarrow_forward
- You are provided with three 2D data points, p1, p2 and p3. Solving A C = B for C provides youwith the coefficients of a natural cubic spline curve that interpolates these points.Additionally, you have been given A and B, but some elements are missing. Moreover, the last two rowsof A are entirely absent. Your task is to determine and fill in the missing elements. For the last two rows,enforce a zero tangent at the beginning (in p1) and a not-a-knot boundary condition in p2. The matricesA and B are given as follows:Explain how to find the entries of A and B . How would you adapt these matrices if the data pointswere 3D? What if your spline should go through five data points? How many “extra rows” would there thenbe (with “extra” meaning “in addition to securing C2-continuity”)?arrow_forwardWhich graph represents f(x) = √x-2+3?arrow_forwardPractice Assignment 5.6 Rational Functions M Practice Assig Practice Assignment 5.6 Rational Functions Score: 120/150 Answered: 12/15 Question 10 A Write an equation for the function graphed below 5 + 4 1 2 H + + -7 -6 -5 -4 -3 -2 -1 2 34567 | -2 ర y = Question Help: Video Message instructor Post to forum Submit Questionarrow_forward
- > co LO -6 -5 -4 4 do 3 3 2 1 Τ O 1 3 4 5 --6- -CO 6arrow_forwardx/x-2 + 3/x-4arrow_forwardQ1: A: Let M and N be two subspace of finite dimension linear space X, show that if M = N then dim M = dim N but the converse need not to be true. B: Let A and B two balanced subsets of a linear space X, show that whether An B and AUB are balanced sets or nor verly A:LeLM be a subset of a linear space X, show that M is a hyperplane of X iff there exists fe X'/[0] and a EF such that M = {x Ex/f(x) = = a}. B:Show that every two norms on finite dimension linear space are equivalent C: Let f be a linear function from a normed space X in to a normed space Y, show that continuous at x, EX iff for any sequence (x) in X converge to x, then the sequence (f(x)) converge to (f(x)) in Y.arrow_forward
 Glencoe Algebra 1, Student Edition, 9780079039897...AlgebraISBN:9780079039897Author:CarterPublisher:McGraw Hill
 Elementary AlgebraAlgebraISBN:9780998625713Author:Lynn Marecek, MaryAnne Anthony-SmithPublisher:OpenStax - Rice University
 Holt Mcdougal Larson Pre-algebra: Student Edition...AlgebraISBN:9780547587776Author:HOLT MCDOUGALPublisher:HOLT MCDOUGAL

 Intermediate AlgebraAlgebraISBN:9781285195728Author:Jerome E. Kaufmann, Karen L. SchwittersPublisher:Cengage Learning