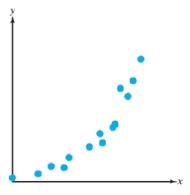
For Exercises 35-38, a graph of data is given. From visual inspection, which model would best fit the data? Choose from y = m x + b linear y = a b x exponential y = a + b ln x logarithmic y = c 1 + a e − b x logistic
For Exercises 35-38, a graph of data is given. From visual inspection, which model would best fit the data? Choose from y = m x + b linear y = a b x exponential y = a + b ln x logarithmic y = c 1 + a e − b x logistic
Solution Summary: The author determines the best fit model for the given data by using virtual inspection. The graph is a graph of an exponential function.
Consider the following system of equations, Ax=b :
x+2y+3z - w = 2
2x4z2w = 3
-x+6y+17z7w = 0
-9x-2y+13z7w = -14
a. Find the solution to the system. Write it as a parametric equation. You can use a
computer to do the row reduction.
b. What is a geometric description of the solution? Explain how you know.
c. Write the solution in vector form?
d. What is the solution to the homogeneous system, Ax=0?
2. Find a matrix A with the following qualities
a. A is 3 x 3.
b. The matrix A is not lower triangular and is not upper triangular.
c. At least one value in each row is not a 1, 2,-1, -2, or 0
d. A is invertible.
Find the exact area inside r=2sin(2\theta ) and outside r=\sqrt(3)
University Calculus: Early Transcendentals (4th Edition)
Knowledge Booster
Learn more about
Need a deep-dive on the concept behind this application? Look no further. Learn more about this topic, calculus and related others by exploring similar questions and additional content below.
Which is the best chart: Selecting among 14 types of charts Part II; Author: 365 Data Science;https://www.youtube.com/watch?v=qGaIB-bRn-A;License: Standard YouTube License, CC-BY


 Glencoe Algebra 1, Student Edition, 9780079039897...AlgebraISBN:9780079039897Author:CarterPublisher:McGraw Hill
 Algebra & Trigonometry with Analytic GeometryAlgebraISBN:9781133382119Author:SwokowskiPublisher:Cengage