
Determinants of demand and it relevance to the equilibrium position.
Explanation of Solution
Transaction demand for money is the need for money to meet the day-to-day expenditures. It varies directly with nominal
Asset demand for money refers to the desire of public to hold money in the form of financial assets, such as stocks, bonds and so forth. If the interest rate is greater, then people would be interested to save more thereby the asset demand for money would be lower and vice versa. Thus interest rate is the major determinant of the asset demand for money.
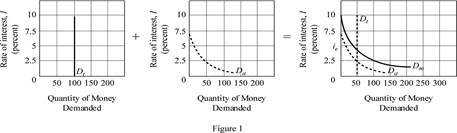
In figure -1, the horizontal axis measures quantity demanded and vertical axis measures the interest rate. The transaction demand for money, represented as Dt, is dependent only on the nominal GDP and has little effect by interest rate, so graphically it is depicted by a vertical line.
The asset demand for money, represented as Da in the figure has an inverse relation with the interest rate since it involves in the
The Total Money demand is the sum of Transaction demand and Asset demand for money
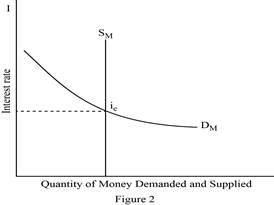
Figure- 2 depicts the equilibrium market, with quantity demanded and supplied measured in the horizontal axis and interest rate in the vertical axis.
The Monetary Authority (usually, the Central Bank of a country) decides on the Money Supply which is unaffected by the decisions that holds money for transaction or as financial asset. The Money Supply (Sm) is depicted by a vertical straight line which is independent of the rate of interest.
The Total Money demand (Dm) depends on the level of income and interest rate. It can be depicted as a linear function of income and interest rate. Demand for money varies directly with levels of income and inversely with the interest rate and slopes downward.
Dm = aY – bi
A
Dm = Sm
The interest rate at which equilibrium is made is the equilibrium interest rate (ie). Thus ie is determined at the point where Dm =Sm.
Let’s now illustrate the effect on equilibrium interest rate due to an increase in the total demand for money.
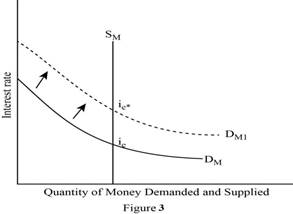
In Figure -3, the horizontal axis measures the quantity of money demanded and supplied and vertical axis represents the interest rate. When the Total money demand increases (shifts to right from DM to DM1) with money supply (SM) remaining constant, the equilibrium interest rate goes up from ie to ie*.
As the money demand increases, the previous interest rate is no longer sustainable because when the demand for money increases it exceeds the supply of money at the previous interest rate. This limits the money available to borrowers or creditors. Also there would be an upward pressure on the interest rate. Thus previous interest rate is no longer maintainable.
Concept Introduction:
Transaction demand for money: It refers to that amount of money required by individuals or firms to finance their current transaction or forthcoming expenditure.
Asset demand for money: It is the extent to which, people hold money in the form of asset.
Total Money demand: It refers to the desire of individuals or firms to hold money in the form of both financial assets and for transactions at each possible interest rate.
Equilibrium Interest rate: It is the point in which demand for money equals with the supply of money.
Want to see more full solutions like this?
Chapter 36 Solutions
ECO 2020 INCLUSIVE ACCESS

- Answerarrow_forwardM” method Given the following model, solve by the method of “M”. (see image)arrow_forwardAs indicated in the attached image, U.S. earnings for high- and low-skill workers as measured by educational attainment began diverging in the 1980s. The remaining questions in this problem set use the model for the labor market developed in class to walk through potential explanations for this trend. 1. Assume that there are just two types of workers, low- and high-skill. As a result, there are two labor markets: supply and demand for low-skill workers and supply and demand for high-skill workers. Using two carefully drawn labor-market figures, show that an increase in the demand for high skill workers can explain an increase in the relative wage of high-skill workers. 2. Using the same assumptions as in the previous question, use two carefully drawn labor-market figures to show that an increase in the supply of low-skill workers can explain an increase in the relative wage of high-skill workers.arrow_forward
- Published in 1980, the book Free to Choose discusses how economists Milton Friedman and Rose Friedman proposed a one-sided view of the benefits of a voucher system. However, there are other economists who disagree about the potential effects of a voucher system.arrow_forwardThe following diagram illustrates the demand and marginal revenue curves facing a monopoly in an industry with no economies or diseconomies of scale. In the short and long run, MC = ATC. a. Calculate the values of profit, consumer surplus, and deadweight loss, and illustrate these on the graph. b. Repeat the calculations in part a, but now assume the monopoly is able to practice perfect price discrimination.arrow_forwardThe projects under the 'Build, Build, Build' program: how these projects improve connectivity and ease of doing business in the Philippines?arrow_forward


 Economics (MindTap Course List)EconomicsISBN:9781337617383Author:Roger A. ArnoldPublisher:Cengage Learning
