Concept explainers
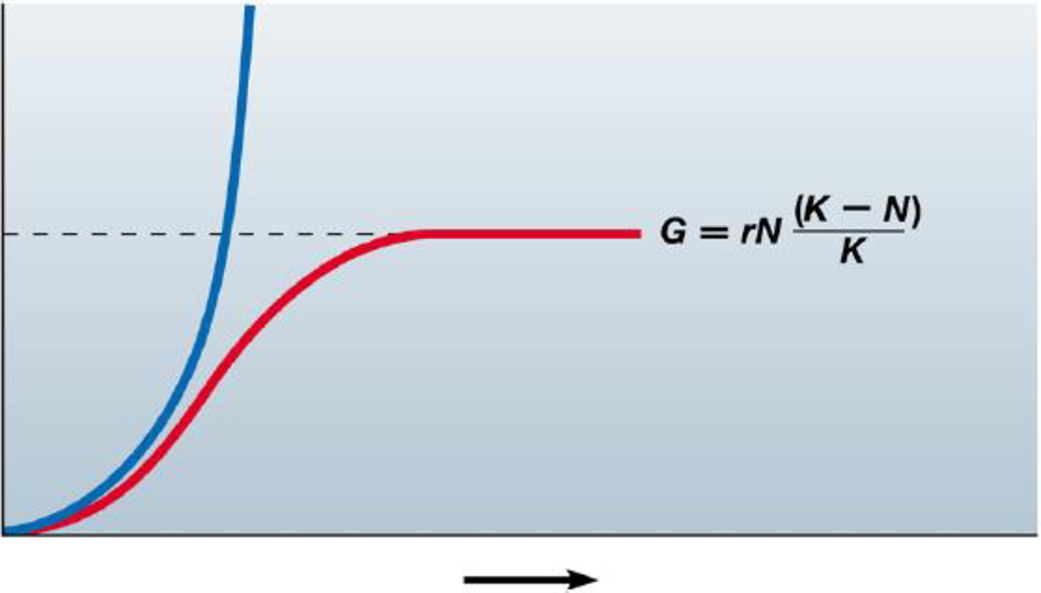
Use this graph of the idealized exponential and
a. Label the axes and curves on the graph.
b. Give the formula that describes the blue curve.
c. What does the dotted line represent?
d. For each curve, indicate and explain where population growth is the most rapid.
e. Which of these curves best represents global human population growth?

a.
To label: The axis and the curves of the graph.
Introduction: Exponential growth curve is the J-shaped curve that is ever increasing in nature. The logistic growth curve is an S shaped curve in which the growth of the population ceases after a certain point which can be represented as the carrying capacity of the population.
Answer to Problem 1CC
Correct answer:
X-axis is time, Y-axis is population size. Blue/thick curve is the exponential growth and red/thin curve is logistic curve
Explanation of Solution
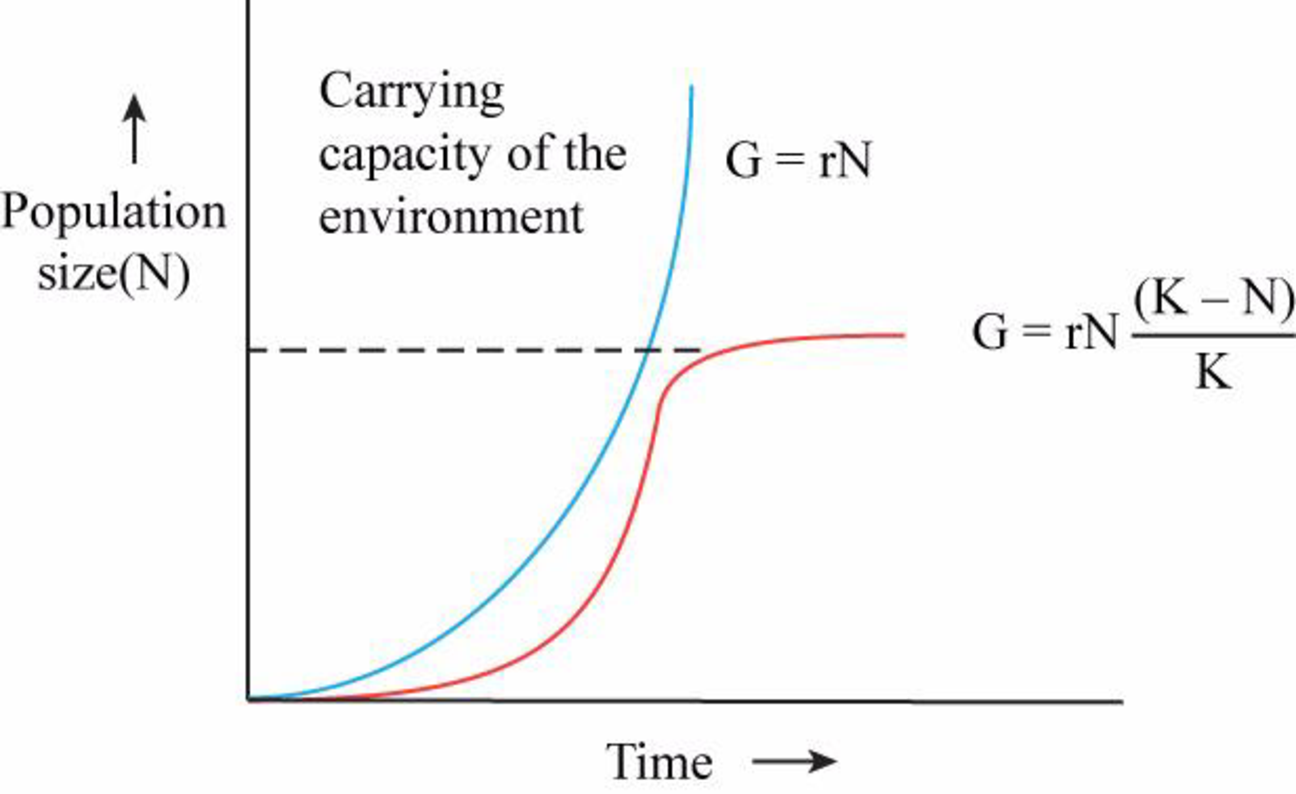
Graphical representation: Fig: 1 shows the graph depicting the logistic and exponential growth curve.

Fig. 1: The graph depicting the logistic and exponential growth curve.
The X-axis of the graph represents the time taken for growth and the Y-axis of the graph represents the size of the population. The blue/thick curve is the exponential growth curve and red/thin curve is logistic growth curve. Hence the correct answer is X-axis is time, Y-axis is population size. Blue/thick curve is the exponential growth and red/thin curve is logistic curve
b.
To give: The formula that describes the blue curve.
Answer to Problem 1CC
Correct answer:
Explanation of Solution
Refer to Fig.1; the blue curve can be described by the formula
c.
To determine: What does the dotted line represents.
Answer to Problem 1CC
Correct answer:
Carrying capacity of the environment (K)
Explanation of Solution
Refer to Fig.1; the dotted line represented on the graph is the carrying capacity of the environment. Hence the correct answer is carrying capacity of the environment (K)
d.
To determine: What does each curve represents.
Answer to Problem 1CC
Correct answer:
Population of logistic curve is most rapid at half of the carrying capacity. Population of exponential growth is most rapid throughout the curve as it is continuously increasing.
Explanation of Solution
Refer to Fig.1; the population growth is most rapid when population attains half of the carrying capacity in logistic curve and the population growth is continuously increasing in the exponential growth curve. Hence the correct answer half of the carrying capacity in logistic curve and continuous growth in exponential growth.
e.
To determine: The curve which represents the global human population.
Answer to Problem 1CC
Correct answer:
Exponential growth curve
Explanation of Solution
Refer to Fig.1; it is the J shaped curve that is continuously increasing is the exponential growth curve. The worldwide population can be represented by this curve as the population is ever increasing. Hence the correct answer is exponential growth curve.
Want to see more full solutions like this?
Chapter 36 Solutions
CAMPBEL BIOLOGY:CONCEPTS & CONNECTIONS
- Molecular Biology Question A gene that codes for a protein was removed from a eukaryotic cell and inserted into a prokaryotic cell. Although the gene was successfully transcribed and translated, it produced a different protein than it produced in the eukaryotic cell. What is the most likely explanation?arrow_forwardMolecular Biology LIST three characteristics of origins of replicationarrow_forwardMolecular Biology Question Please help. Thank you For E coli DNA polymerase III, give the structure and function of the b-clamp sub-complex. Describe how the structure of this sub-complex is important for it’s function.arrow_forward
- Molecular Biology LIST three characteristics of DNA Polymerasesarrow_forwardMolecular Biology RNA polymerase core enzyme structure contains what subunits? To form holo enzyme, sigma factor is added to core. What is the name of the structure formed? Give the detailed structure of sigma factor and the function of eachdomain. Please help. Thank youarrow_forwardMolecular Biology You have a single bacterial cell whose DNA is labelled with radioactiveC14. After 5 rounds of cell division, how may cells will contain radioactive DNA? Please help. Thank youarrow_forward
- 1. Explain the structure and properties of atoms and chemical bonds (especially how they relate to DNA and proteins). Also add some pictures.arrow_forward1. In the Sentinel Cell DNA integrity is preserved through nanoscopic helicase-coordinated repair, while lipids in the membrane are fortified to resist environmental mutagens. also provide pictures for this question.arrow_forwardExplain the structure and properties of atoms and chemical bonds (especially how they relate to DNA and proteins). Also add some pictures.arrow_forward
- In the Sentinel Cell DNA integrity is preserved through nanoscopic helicase-coordinated repair, while lipids in the membrane are fortified to resist environmental mutagens. also provide pictures for this question.arrow_forward1. Explain how genetic information is stored, copied, transferred, and expressed. Also add some pictures for this question.arrow_forward!. Describe biological macromolecules (DNA, RNA, proteins, lipids, etc.) and how they function in the cell. also provide some images for this question.arrow_forward
- Case Studies In Health Information ManagementBiologyISBN:9781337676908Author:SCHNERINGPublisher:Cengage
 Biology (MindTap Course List)BiologyISBN:9781337392938Author:Eldra Solomon, Charles Martin, Diana W. Martin, Linda R. BergPublisher:Cengage Learning
 Concepts of BiologyBiologyISBN:9781938168116Author:Samantha Fowler, Rebecca Roush, James WisePublisher:OpenStax College
  Biology 2eBiologyISBN:9781947172517Author:Matthew Douglas, Jung Choi, Mary Ann ClarkPublisher:OpenStax
 Principles Of Radiographic Imaging: An Art And A ...Health & NutritionISBN:9781337711067Author:Richard R. Carlton, Arlene M. Adler, Vesna BalacPublisher:Cengage Learning


