
Videos
a.
To describe:The commutation to school in words.
First 10 minutes commute is by walking, then 4 minutes rest, then commute by bus with speed for 4 minutes.
Given:
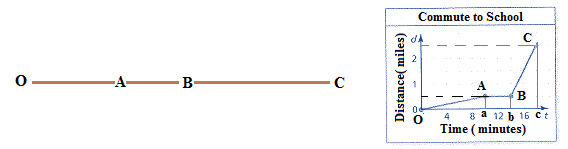
The commute to school by walking and riding by bus is shown by distance- time graph below:
Formula/ concept used:
The slope of distance time graph gives the velocity of the object. The slope of a line is the ratio y- distance to x -distance.
Description:
The commute is described by the graph initial point
Motion O to A:The slope of graph is very small so commute from O to A is by walking for first 10 minutes of the journey.
Motion A to B:The slope of the graph O to B is zero so the speed is also zero. Thus from A to B for 10th to 14th minutes I take rest.
Motion B to C:For the motion from 14th to 18th minutes, the slope of the graph is higher so commute from B to C is by bus for first4 minutes of the journey.
Conclusion:
First 10 minutes commute is by walking, then 4 minutes rest, then commute by bus with speed for 4 minutes.
b.
To calculate:The slope of different parts of the graph in Part (a) and interpret it.
First 10 minutes commute is with speed 3 miles/ hour, then 4 minutes rest then commute by bus with speed 45 miles / hour for 4 minutes.
Given:
The distance −time graph in part (a)
Concept used:
The slope of distance −time graph gives the velocity/ speed of the object.
Calculations:
Motion O to A: My speed from O to A is approximately
Motion A to B: The slope of the graph O to B is zero so the speed is also zero. Thus from A to B for 10th to 14th minutes I take rest.
Motion B to C:For the motion from 14th to 18th minutes, the speed is
Conclusion:
First 10 minutes commute is with speed 3 miles/ hour, then 4 minutes rest then commute by bus with speed 45 miles / hour for 4 minutes.
Chapter 3 Solutions
BIG IDEAS MATH Algebra 1: Common Core Student Edition 2015


- Questions 1. Identify and describe potential bias in the study. 2. Identify and describe the way in which the selected participants may or may not represent the population as a whole. 3. Identify and describe the possible problems with the end results since the majority will be from females rather than an even split. 4. Identify and describe the possible problems with identifying females as possibly more vulnerable based on the data collected. 5. Identify a possible null hypothesis and problems in how the study might address this null hypothesis. 6. Identify one possible method of improving the study design and describe how it would improve the validity of the conclusions. 7. Identify a second possible method of improving the study design and describe how it would improve the validity of the conclusions.arrow_forwardThe Course Name Real Analysis please Solve questions by Real Analysisarrow_forwardpart 3 of the question is: A power outage occurs 6 min after the ride started. Passengers must wait for their cage to be manually cranked into the lowest position in order to exit the ride. Sine function model: where h is the height of the last passenger above the ground measured in feet and t is the time of operation of the ride in minutes. What is the height of the last passenger at the moment of the power outage? Verify your answer by evaluating the sine function model. Will the last passenger to board the ride need to wait in order to exit the ride? Explain.arrow_forward
- 2. The duration of the ride is 15 min. (a) How many times does the last passenger who boarded the ride make a complete loop on the Ferris wheel? (b) What is the position of that passenger when the ride ends?arrow_forward3. A scientist recorded the movement of a pendulum for 10 s. The scientist began recording when the pendulum was at its resting position. The pendulum then moved right (positive displacement) and left (negative displacement) several times. The pendulum took 4 s to swing to the right and the left and then return to its resting position. The pendulum's furthest distance to either side was 6 in. Graph the function that represents the pendulum's displacement as a function of time. Answer: f(t) (a) Write an equation to represent the displacement of the pendulum as a function of time. (b) Graph the function. 10 9 8 7 6 5 4 3 2 1 0 t 1 2 3 4 5 6 7 8 9 10 11 12 13 14 15 -1 -5. -6 -7 -8 -9 -10-arrow_forwardA power outage occurs 6 min after the ride started. Passengers must wait for their cage to be manually cranked into the lowest position in order to exit the ride. Sine function model: h = −82.5 cos (3πt) + 97.5 where h is the height of the last passenger above the ground measured in feet and t is the time of operation of the ride in minutes. (a) What is the height of the last passenger at the moment of the power outage? Verify your answer by evaluating the sine function model. (b) Will the last passenger to board the ride need to wait in order to exit the ride? Explain.arrow_forward
- The Colossus Ferris wheel debuted at the 1984 New Orleans World's Fair. The ride is 180 ft tall, and passengers board the ride at an initial height of 15 ft above the ground. The height above ground, h, of a passenger on the ride is a periodic function of time, t. The graph displays the height above ground of the last passenger to board over the course of the 15 min ride. Height of Passenger in Ferris Wheel 180 160 140- €120 Height, h (ft) 100 80 60 40 20 0 ך 1 2 3 4 5 6 7 8 9 10 11 12 13 14 15 Time of operation, t (min) Sine function model: h = −82.5 cos (3πt) + 97.5 where h is the height of the passenger above the ground measured in feet and t is the time of operation of the ride in minutes. What is the period of the sine function model? Interpret the period you found in the context of the operation of the Ferris wheel. Answer:arrow_forward1. Graph the function f(x)=sin(x) −2¸ Answer: y -2π 一元 1 −1 -2 -3 -4+ 元 2πarrow_forward3. Graph the function f(x) = −(x-2)²+4 Answer: f(x) 6 5 4 3 2+ 1 -6-5 -4-3-2-1 × 1 2 3 4 5 6 -1 -2+ ရာ -3+ -4+ -5 -6arrow_forward
- 2. Graph the function f(x) = cos(2x)+1 Answer: -2π 一元 y 3 2- 1 -1 -2+ ရာ -3- Π 2πarrow_forward2. Graph the function f(x) = |x+1+2 Answer: -6-5-4-3-2-1 f(x) 6 5 4 3 2 1 1 2 3 4 5 6 -1 -2 -3 -4 -5 -6arrow_forward1. The table shows values of a function f(x). What is the average rate of change of f(x) over the interval from x = 5 to x = 9? Show your work. X 4 f(x) LO 5 6 7 8 9 10 -2 8 10 11 14 18arrow_forward
 Algebra and Trigonometry (6th Edition)AlgebraISBN:9780134463216Author:Robert F. BlitzerPublisher:PEARSON
 Contemporary Abstract AlgebraAlgebraISBN:9781305657960Author:Joseph GallianPublisher:Cengage Learning
 Linear Algebra: A Modern IntroductionAlgebraISBN:9781285463247Author:David PoolePublisher:Cengage Learning
 Algebra And Trigonometry (11th Edition)AlgebraISBN:9780135163078Author:Michael SullivanPublisher:PEARSON
 Introduction to Linear Algebra, Fifth EditionAlgebraISBN:9780980232776Author:Gilbert StrangPublisher:Wellesley-Cambridge Press
 College Algebra (Collegiate Math)AlgebraISBN:9780077836344Author:Julie Miller, Donna GerkenPublisher:McGraw-Hill Education