
Concept explainers
Videos
The bar graph shows the amount, in billions of dollars, that the United States government spent on human resources and total budget outlays for six selected years, (Human resources include education, health, Medicare. Social Security, and veterans benefits and services.)
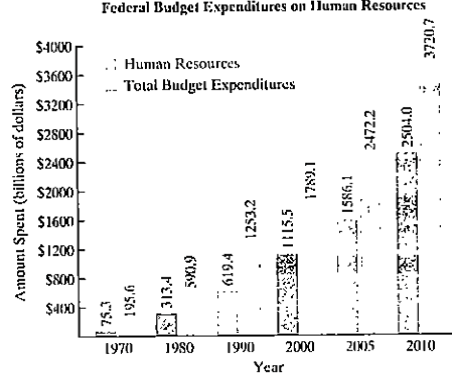
Source: Office of Management and Budget
The function p(x) = 1.75x2 – 15.9x + 160 models the amount. p(x), in billions of dollars, that the United States government spent on human resources x years after 1970. The function q(x) = 2.1x2 - 3.5x+ 296 models total budget expenditures, q(x), in billions of dollars, x years after 1970.
a. Use p and q to write a rational function that models the fraction of total budget outlays spent on human resources x years after 1970.
b. Use the data displayed by the bar graph to find the percentage of federal expenditures spent on human resources in 2010. Round to the nearest percent.
c. Use the rational function from part (a) to find the percentage of federal expenditures spent on human resources in 2010. Round to the nearest percent. Does this underestimate or overestimate the actual percent that you found in part (b)? By how much?
d. What is the equation of the horizontal asymptote associated with the rational function in part (a)? If trends modeled by the function continue, what percentage of the federal budget will be spent on human resources over time? Round to the nearest percent.
Want to see the full answer?
Check out a sample textbook solution
Chapter 3 Solutions
COLLEGE ALGEBRA - MYMATHLAB (24 MONTHS)


- Solve questions by Course Name (Ordinary Differential Equations II 2)arrow_forwardplease Solve questions by Course Name( Ordinary Differential Equations II 2)arrow_forwardInThe Northern Lights are bright flashes of colored light between 50 and 200 miles above Earth. Suppose a flash occurs 150 miles above Earth. What is the measure of arc BD, the portion of Earth from which the flash is visible? (Earth’s radius is approximately 4000 miles.)arrow_forward
- e). n! (n - 1)!arrow_forwardSuppose you flip a fair two-sided coin four times and record the result. a). List the sample space of this experiment. That is, list all possible outcomes that could occur when flipping a fair two-sided coin four total times. Assume the two sides of the coin are Heads (H) and Tails (T).arrow_forwarde). n! (n - 1)!arrow_forward
- Evaluate the following expression and show your work to support your calculations. a). 6! b). 4! 3!0! 7! c). 5!2! d). 5!2! e). n! (n - 1)!arrow_forwardAmy and Samiha have a hat that contains two playing cards, one ace and one king. They are playing a game where they randomly pick a card out of the hat four times, with replacement. Amy thinks that the probability of getting exactly two aces in four picks is equal to the probability of not getting exactly two aces in four picks. Samiha disagrees. She thinks that the probability of not getting exactly two aces is greater. The sample space of possible outcomes is listed below. A represents an ace, and K represents a king. Who is correct?arrow_forwardConsider the exponential function f(x) = 12x. Complete the sentences about the key features of the graph. The domain is all real numbers. The range is y> 0. The equation of the asymptote is y = 0 The y-intercept is 1arrow_forward
 Big Ideas Math A Bridge To Success Algebra 1: Stu...AlgebraISBN:9781680331141Author:HOUGHTON MIFFLIN HARCOURTPublisher:Houghton Mifflin Harcourt
 College Algebra (MindTap Course List)AlgebraISBN:9781305652231Author:R. David Gustafson, Jeff HughesPublisher:Cengage Learning
 Glencoe Algebra 1, Student Edition, 9780079039897...AlgebraISBN:9780079039897Author:CarterPublisher:McGraw Hill
 Holt Mcdougal Larson Pre-algebra: Student Edition...AlgebraISBN:9780547587776Author:HOLT MCDOUGALPublisher:HOLT MCDOUGAL
