
Elementary Statistics: A Step By Step Approach
10th Edition
ISBN: 9781259755330
Author: Allan G. Bluman
Publisher: McGraw-Hill Education
expand_more
expand_more
format_list_bulleted
Concept explainers
Videos
Textbook Question
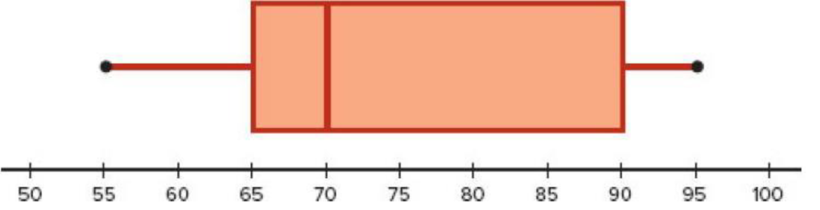
Chapter 3.4, Problem 9E
For Exercises 7–10, use each boxplot to identify the maximum value, minimum value,
9. 
Expert Solution & Answer
Want to see the full answer?
Check out a sample textbook solution
Students have asked these similar questions
For the distribution shown, match the letter to the measure of central tendency.
A B C
C
Drag each of the letters into the appropriate measure of central tendency.
Mean
C
Median
A
Mode
B
A physician who has a group of 38 female patients aged 18 to 24 on a special diet wishes to estimate the effect of the diet on total serum cholesterol. For this group, their average serum cholesterol is 188.4 (measured in mg/100mL). Suppose that the total serum cholesterol measurements are normally distributed with standard deviation of 40.7. (a) Find a 95% confidence interval of the mean serum cholesterol of patients on the special diet.
The accompanying data represent the weights (in grams) of a simple random sample of 10 M&M plain candies. Determine the shape of the distribution of weights of M&Ms by drawing a frequency
histogram. Find the mean and median. Which measure of central tendency better describes the weight of a plain M&M?
Click the icon to view the candy weight data.
Draw a frequency histogram. Choose the correct graph below.
○ A.
○ C.
Frequency
Weight of Plain M and Ms
0.78
0.84
Frequency
OONAG
0.78
B.
0.9
0.96
Weight (grams)
Weight of Plain M and Ms
0.84
0.9
0.96
Weight (grams)
○ D.
Candy Weights
0.85 0.79 0.85 0.89 0.94
0.86 0.91 0.86 0.87 0.87
-
Frequency
☑
Frequency
67200
0.78
→
Weight of Plain M and Ms
0.9
0.96
0.84
Weight (grams)
Weight of Plain M and Ms
0.78
0.84
Weight (grams)
0.9
0.96
→
Chapter 3 Solutions
Elementary Statistics: A Step By Step Approach
Ch. 3.1 - Teacher Salaries The following data from several...Ch. 3.1 - Roller Coaster Speeds The data show the heights in...Ch. 3.1 - Airport Parking The number of short-term parking...Ch. 3.1 - Length of School Years The lengths of school years...Ch. 3.1 - Observers in the Frogwatch Program The number of...Ch. 3.1 - Top Video Games The following represent XBOX One...Ch. 3.1 - Earnings of Nonliving Celebrities Forbes magazine...Ch. 3.1 - Paid Days Off The data show the number of paid...Ch. 3.1 - Top-Paid CEOs The data shown are the total...Ch. 3.1 - Airline Passengers The data show a sample of the...
Ch. 3.1 - Foreign Workers The number of foreign workers...Ch. 3.1 - Distances of Stars Of the 25 brightest stars, the...Ch. 3.1 - Contest Spelling Words The last words given and...Ch. 3.1 - Wind Speeds The data show the maximum wind speeds...Ch. 3.1 - Hourly Compensation for Production Workers The...Ch. 3.1 - Points in Rose Bowl Games The data show the number...Ch. 3.1 - Percentage of Foreign-Born People The percentage...Ch. 3.1 - Percentage of College-Educated Population over 25...Ch. 3.1 - Net Worth of Corporations These data represent the...Ch. 3.1 - Specialty Coffee Shops A random sample of 30...Ch. 3.1 - Commissions Earned This frequency distribution...Ch. 3.1 - Children of U.S. Presidents The data show the...Ch. 3.1 - Enrollments for Selected Independent Religiously...Ch. 3.1 - Automobile Selling Prices Find the weighted mean...Ch. 3.1 - Fat Grams Using the weighted mean, find the...Ch. 3.1 - Diet Cola Preference A recent survey of a new diet...Ch. 3.1 - Costs of Helicopters The costs of three models of...Ch. 3.1 - Final Grade An instructor grades exams, 20%; term...Ch. 3.1 - Final Grade Another instructor gives four 1-hour...Ch. 3.1 - For these situations, state which measure of...Ch. 3.1 - Describe which measure of central tendencymean,...Ch. 3.1 - What types of symbols are used to represent sample...Ch. 3.1 - A local fast-food company claims that the average...Ch. 3.1 - If the mean of five values is 64, find the sum of...Ch. 3.1 - If the mean of five values is 8.2 and four of the...Ch. 3.1 - Find the mean of 10, 20, 30, 40, and 50. a. Add 10...Ch. 3.1 - Harmonic Mean The harmonic mean (HM) is defined as...Ch. 3.1 - Geometric Mean The geometric mean (GM) is defined...Ch. 3.1 - Quadratic Mean A useful mean in the physical...Ch. 3.1 - Median for Grouped Data An approximate median can...Ch. 3.2 - Blood Pressure The table lists means and standard...Ch. 3.2 - What is the relationship between the variance and...Ch. 3.2 - Why might the range not be the best estimate of...Ch. 3.2 - What are the symbols used to represent the...Ch. 3.2 - What are the symbols used to represent the sample...Ch. 3.2 - Why is the unbiased estimator of variance used?Ch. 3.2 - The three data sets have the same mean and range,...Ch. 3.2 - Traveler Spending The data show the traveler...Ch. 3.2 - Cigarette Taxes The increases (in cents) in...Ch. 3.2 - Prob. 9ECh. 3.2 - Size of U.S. States The total surface area (in...Ch. 3.2 - Multiple Births The numbers of various multiple...Ch. 3.2 - Starting Teachers Salaries Starting teachers...Ch. 3.2 - Ages of U.S. Astronaut Candidates The average age...Ch. 3.2 - Times Spent in Rush-Hour Traffic A sample of 12...Ch. 3.2 - Laws Passed The data show the number of public...Ch. 3.2 - Passenger Vehicle Deaths The number of people...Ch. 3.2 - Annual Precipitation Days The number of annual...Ch. 3.2 - Use the data from Exercises 7, 15, and 17...Ch. 3.2 - Pupils Per Teacher The following frequency...Ch. 3.2 - Automotive Fuel Efficiency Thirty automobiles were...Ch. 3.2 - Murders in Cities The data show the number of...Ch. 3.2 - Reaction Times In a study of reaction times to a...Ch. 3.2 - FM Radio Stations A random sample of 30 states...Ch. 3.2 - Murder Rates The data represent the murder rate...Ch. 3.2 - Waterfall Heights The frequency distribution shows...Ch. 3.2 - Baseball Team Batting Averages Team batting...Ch. 3.2 - Missing Work The average number of days that...Ch. 3.2 - Suspension Bridges The lengths (in feet) of the...Ch. 3.2 - Hospital Emergency Waiting Times The mean of the...Ch. 3.2 - Ages of Accountants The average age of the...Ch. 3.2 - Using Chebyshevs theorem, solve these problems for...Ch. 3.2 - The mean of a distribution is 20 and the standard...Ch. 3.2 - In a distribution of 160 values with a mean of 72,...Ch. 3.2 - Calories in Bagels The average number of calories...Ch. 3.2 - Time Spent Online Americans spend an average of 3...Ch. 3.2 - Solid Waste Production The average college student...Ch. 3.2 - Sale Price of Homes The average sale price of...Ch. 3.2 - Trials to Learn a Maze The average of the number...Ch. 3.2 - Farm Sizes The average farm in the United States...Ch. 3.2 - Citrus Fruit Consumption The average U.S. yearly...Ch. 3.2 - SAT Scores The national average for mathematics...Ch. 3.2 - Work Hours for College Faculty The average...Ch. 3.2 - Prices of Musical Instruments The average price of...Ch. 3.2 - Hours of Employment The mean and standard...Ch. 3.2 - Prob. 45ECh. 3.2 - Bonuses The mean and standard deviation of the...Ch. 3.2 - Serum Cholesterol Levels For this data set, find...Ch. 3.2 - Ages of Consumers For this data set, find the mean...Ch. 3.2 - Prob. 49ECCh. 3.2 - Use this data set: 10, 20, 30, 40, 50 a. Find the...Ch. 3.2 - Mean Deviation The mean deviation is found by...Ch. 3.2 - Pearson Coefficient of Skewness A measure to...Ch. 3.2 - All values of a data set must be within sn1 of the...Ch. 3.3 - Determining Dosages In an attempt to determine...Ch. 3.3 - What is a z score?Ch. 3.3 - Define percentile rank.Ch. 3.3 - What is the difference between a percentage and a...Ch. 3.3 - Define quartile.Ch. 3.3 - What is the relationship between quartiles and...Ch. 3.3 - What is a decile?Ch. 3.3 - How are deciles related to percentiles?Ch. 3.3 - To which percentile, quartile, and decile does the...Ch. 3.3 - Vacation Days If the average number of vacation...Ch. 3.3 - Age of Senators The average age of Senators in the...Ch. 3.3 - Marriage Age for Females The mean age at which...Ch. 3.3 - Teachers Salary The average teachers salary in a...Ch. 3.3 - Test Scores Which is a better relative position, a...Ch. 3.3 - College and University Debt A student graduated...Ch. 3.3 - Annual Miles Driven The average miles driven...Ch. 3.3 - Which score indicates the highest relative...Ch. 3.3 - The data show the population (in thousands) for a...Ch. 3.3 - College Room and Board Costs Room and board costs...Ch. 3.3 - Achievement Test Scores The data shown represent...Ch. 3.3 - Airplane Speeds The airborne speeds in miles per...Ch. 3.3 - Average Weekly Earnings The average weekly...Ch. 3.3 - Test Scores Find the percentile rank for each test...Ch. 3.3 - Hurricane Damage Find the percentile rank for each...Ch. 3.3 - Test Scores Find the percentile rank for each test...Ch. 3.3 - Taxes The data for a recent year show the taxes...Ch. 3.3 - Medical Marijuana 2015 Sales Tax: The data show...Ch. 3.3 - Gold Reserves The data show the gold reserves for...Ch. 3.3 - Police Calls in Schools The number of incidents in...Ch. 3.3 - Check each data set for outliers. a. 46, 28, 32,...Ch. 3.3 - Check each data set for outliers. a. 88, 72, 97,...Ch. 3.3 - Another measure of the average is called the...Ch. 3.3 - An employment evaluation exam has a variance of...Ch. 3.3 - A particular standardized test has scores that...Ch. 3.4 - Applying the Concepts 34 The Noisy Workplace...Ch. 3.4 - For Exercises 16, identify the five-number summary...Ch. 3.4 - For Exercises 16, identify the five-number summary...Ch. 3.4 - For Exercises 16, identify the five-number summary...Ch. 3.4 - For Exercises 16, identify the five-number summary...Ch. 3.4 - For Exercises 16, identify the five-number summary...Ch. 3.4 - For Exercises 16, identify the five-number summary...Ch. 3.4 - For Exercises 710, use each boxplot to identify...Ch. 3.4 - For Exercises 710, use each boxplot to identify...Ch. 3.4 - For Exercises 710, use each boxplot to identify...Ch. 3.4 - For Exercises 7-10. use each boxplot to identify-...Ch. 3.4 - School Graduation Rates The data show a sample of...Ch. 3.4 - Innings Pitched Construct a boxplot for the...Ch. 3.4 - Population of Colonies The data show the...Ch. 3.4 - Visitors Who Travel to Foreign Countries Construct...Ch. 3.4 - Areas of Islands The data show the sizes in square...Ch. 3.4 - Size of Dams These data represent the volumes in...Ch. 3.4 - Largest Dams The data show the heights (in feet)...Ch. 3.4 - Number of Tornadoes A four-month record for the...Ch. 3.4 - Unhealthy Smog Days A modified boxplot can be...Ch. 3 - Bank Failures The data show the number of bank...Ch. 3 - Shark Attacks The number of shark attacks and...Ch. 3 - AID: 1825 | 29/05/2018 3. Systolic Blood Pressure...Ch. 3 - SAT Scores The mean SAT math scores for selected...Ch. 3 - Households of Four Television Networks A survey...Ch. 3 - Investment Earnings An investor calculated these...Ch. 3 - Confirmed Measles Cases The data show a sample of...Ch. 3 - Tallest Buildings The number of stories in the 13...Ch. 3 - Rise in Tides Shown here is a frequency...Ch. 3 - Fuel Capacity The fuel capacity in gallons for...Ch. 3 - If the range of a data set is 24, find the...Ch. 3 - If the range of a data set is 56, find the...Ch. 3 - Textbooks in Professors Offices If the average...Ch. 3 - Magazines in Bookstores A survey of bookstores...Ch. 3 - Cost of Car Rentals A survey of car rental...Ch. 3 - AID: 1825 | 28/05/2018 16. Average Earnings of...Ch. 3 - Labor Charges The average labor charge for...Ch. 3 - Costs to Train Employees For a certain type of...Ch. 3 - Cost of a Mans Haircut The average cost of a mans...Ch. 3 - Exam Completion Time The mean time it takes a...Ch. 3 - Cases of Meningitis The data show the number of...Ch. 3 - Exam Grades Which of these exam grades has a...Ch. 3 - The number of police calls a small police...Ch. 3 - Printer Repairs The frequency distribution shows...Ch. 3 - Check each data set for outliers. a. 506, 511,...Ch. 3 - Check each data set for outliers. a. 14, 18, 27,...Ch. 3 - Named Storms The data show the number of named...Ch. 3 - Hours Worked The data shown here represent the...Ch. 3 - From the Data Bank, choose one of the following...Ch. 3 - Prob. 2DACh. 3 - Prob. 3DACh. 3 - Randomly select 10 values from the number of...Ch. 3 - Prob. 5DACh. 3 - AID: 1825 | 28/05/2018 Determine whether each...Ch. 3 - Prob. 2CQCh. 3 - Determine whether each statement is true or false....Ch. 3 - Prob. 4CQCh. 3 - In a data set, the mode will always be unique.Ch. 3 - Prob. 6CQCh. 3 - Determine whether each statement is true or false....Ch. 3 - Prob. 8CQCh. 3 - Determine whether each statement is true or false....Ch. 3 - Prob. 10CQCh. 3 - Prob. 11CQCh. 3 - Prob. 12CQCh. 3 - Which is not part of the five-number summary? a....Ch. 3 - A statistic that tells the number of standard...Ch. 3 - When a distribution is bell-shaped, approximately...Ch. 3 - Prob. 16CQCh. 3 - Generally, Greek letters are used to represent...Ch. 3 - Prob. 18CQCh. 3 - The symbol for the population standard deviation...Ch. 3 - When the sum of the lowest data value and the...Ch. 3 - If the mode is to the left of the median and the...Ch. 3 - An extremely high or extremely low data value is...Ch. 3 - Prob. 23CQCh. 3 - Prob. 24CQCh. 3 - Employee Years of Service In an advertisement, a...Ch. 3 - Newspapers for Sale The average number of...Ch. 3 - Prob. 27CQCh. 3 - Hours Worked The data shown here represent the...Ch. 3 - Prob. 29CQCh. 3 - Prob. 30CQCh. 3 - Exam Scores On a philosophy comprehensive exam,...Ch. 3 - Prob. 32CQCh. 3 - Prob. 1CTCCh. 3 - Ages of U.S. Residents The table shows the median...
Knowledge Booster


Learn more about
Need a deep-dive on the concept behind this application? Look no further. Learn more about this topic, statistics and related others by exploring similar questions and additional content below.Similar questions
- The acidity or alkalinity of a solution is measured using pH. A pH less than 7 is acidic; a pH greater than 7 is alkaline. The accompanying data represent the pH in samples of bottled water and tap water. Complete parts (a) and (b). Click the icon to view the data table. (a) Determine the mean, median, and mode pH for each type of water. Comment on the differences between the two water types. Select the correct choice below and fill in any answer boxes in your choice. A. For tap water, the mean pH is (Round to three decimal places as needed.) B. The mean does not exist. Data table Тар 7.64 7.45 7.45 7.10 7.46 7.50 7.68 7.69 7.56 7.46 7.52 7.46 5.15 5.09 5.31 5.20 4.78 5.23 Bottled 5.52 5.31 5.13 5.31 5.21 5.24 - ☑arrow_forwardく Chapter 5-Section 1 Homework X MindTap - Cengage Learning x + C webassign.net/web/Student/Assignment-Responses/submit?pos=3&dep=36701632&tags=autosave #question3874894_3 M Gmail 品 YouTube Maps 5. [-/20 Points] DETAILS MY NOTES BBUNDERSTAT12 5.1.020. ☆ B Verify it's you Finish update: All Bookmarks PRACTICE ANOTHER A computer repair shop has two work centers. The first center examines the computer to see what is wrong, and the second center repairs the computer. Let x₁ and x2 be random variables representing the lengths of time in minutes to examine a computer (✗₁) and to repair a computer (x2). Assume x and x, are independent random variables. Long-term history has shown the following times. 01 Examine computer, x₁₁ = 29.6 minutes; σ₁ = 8.1 minutes Repair computer, X2: μ₂ = 92.5 minutes; σ2 = 14.5 minutes (a) Let W = x₁ + x2 be a random variable representing the total time to examine and repair the computer. Compute the mean, variance, and standard deviation of W. (Round your answers…arrow_forwardThe acidity or alkalinity of a solution is measured using pH. A pH less than 7 is acidic; a pH greater than 7 is alkaline. The accompanying data represent the pH in samples of bottled water and tap water. Complete parts (a) and (b). Click the icon to view the data table. (a) Determine the mean, median, and mode pH for each type of water. Comment on the differences between the two water types. Select the correct choice below and fill in any answer boxes in your choice. A. For tap water, the mean pH is (Round to three decimal places as needed.) B. The mean does not exist. Data table Тар Bottled 7.64 7.45 7.46 7.50 7.68 7.45 7.10 7.56 7.46 7.52 5.15 5.09 5.31 5.20 4.78 5.52 5.31 5.13 5.31 5.21 7.69 7.46 5.23 5.24 Print Done - ☑arrow_forward
- The median for the given set of six ordered data values is 29.5. 9 12 23 41 49 What is the missing value? The missing value is ☐.arrow_forwardFind the population mean or sample mean as indicated. Sample: 22, 18, 9, 6, 15 □ Select the correct choice below and fill in the answer box to complete your choice. O A. x= B. μεarrow_forwardWhy the correct answer is letter A? Students in an online course are each randomly assigned to receive either standard practice exercises or adaptivepractice exercises. For the adaptive practice exercises, the next question asked is determined by whether the studentgot the previous question correct. The teacher of the course wants to determine whether there is a differencebetween the two practice exercise types by comparing the proportion of students who pass the course from eachgroup. The teacher plans to test the null hypothesis that versus the alternative hypothesis , whererepresents the proportion of students who would pass the course using standard practice exercises andrepresents the proportion of students who would pass the course using adaptive practice exercises.The teacher knows that the percent confidence interval for the difference in proportion of students passing thecourse for the two practice exercise types (standard minus adaptive) is and the percent…arrow_forward
- Carpetland salespersons average $8,000 per week in sales. Steve Contois, the firm's vice president, proposes a compensation plan with new selling incentives. Steve hopes that the results of a trial selling period will enable him to conclude that the compensation plan increases the average sales per salesperson. a. Develop the appropriate null and alternative hypotheses.H 0: H a:arrow_forwardتوليد تمرين شامل حول الانحدار الخطي المتعدد بطريقة المربعات الصغرىarrow_forwardThe U.S. Postal Service will ship a Priority Mail® Large Flat Rate Box (12" 3 12" 3 5½") any where in the United States for a fixed price, regardless of weight. The weights (ounces) of 20 ran domly chosen boxes are shown below. (a) Make a stem-and-leaf diagram. (b) Make a histogram. (c) Describe the shape of the distribution. Weights 72 86 28 67 64 65 45 86 31 32 39 92 90 91 84 62 80 74 63 86arrow_forward
- (a) What is a bimodal histogram? (b) Explain the difference between left-skewed, symmetric, and right-skewed histograms. (c) What is an outlierarrow_forward(a) Test the hypothesis. Consider the hypothesis test Ho = : against H₁o < 02. Suppose that the sample sizes aren₁ = 7 and n₂ = 13 and that $² = 22.4 and $22 = 28.2. Use α = 0.05. Ho is not ✓ rejected. 9-9 IV (b) Find a 95% confidence interval on of 102. Round your answer to two decimal places (e.g. 98.76).arrow_forwardLet us suppose we have some article reported on a study of potential sources of injury to equine veterinarians conducted at a university veterinary hospital. Forces on the hand were measured for several common activities that veterinarians engage in when examining or treating horses. We will consider the forces on the hands for two tasks, lifting and using ultrasound. Assume that both sample sizes are 6, the sample mean force for lifting was 6.2 pounds with standard deviation 1.5 pounds, and the sample mean force for using ultrasound was 6.4 pounds with standard deviation 0.3 pounds. Assume that the standard deviations are known. Suppose that you wanted to detect a true difference in mean force of 0.25 pounds on the hands for these two activities. Under the null hypothesis, 40 = 0. What level of type II error would you recommend here? Round your answer to four decimal places (e.g. 98.7654). Use a = 0.05. β = i What sample size would be required? Assume the sample sizes are to be equal.…arrow_forward
arrow_back_ios
SEE MORE QUESTIONS
arrow_forward_ios
Recommended textbooks for you
 Glencoe Algebra 1, Student Edition, 9780079039897...AlgebraISBN:9780079039897Author:CarterPublisher:McGraw Hill
 Holt Mcdougal Larson Pre-algebra: Student Edition...AlgebraISBN:9780547587776Author:HOLT MCDOUGALPublisher:HOLT MCDOUGAL
 Big Ideas Math A Bridge To Success Algebra 1: Stu...AlgebraISBN:9781680331141Author:HOUGHTON MIFFLIN HARCOURTPublisher:Houghton Mifflin Harcourt
 Functions and Change: A Modeling Approach to Coll...AlgebraISBN:9781337111348Author:Bruce Crauder, Benny Evans, Alan NoellPublisher:Cengage Learning
Glencoe Algebra 1, Student Edition, 9780079039897...
Algebra
ISBN:9780079039897
Author:Carter
Publisher:McGraw Hill
Holt Mcdougal Larson Pre-algebra: Student Edition...
Algebra
ISBN:9780547587776
Author:HOLT MCDOUGAL
Publisher:HOLT MCDOUGAL
Big Ideas Math A Bridge To Success Algebra 1: Stu...
Algebra
ISBN:9781680331141
Author:HOUGHTON MIFFLIN HARCOURT
Publisher:Houghton Mifflin Harcourt
Functions and Change: A Modeling Approach to Coll...
Algebra
ISBN:9781337111348
Author:Bruce Crauder, Benny Evans, Alan Noell
Publisher:Cengage Learning
The Shape of Data: Distributions: Crash Course Statistics #7; Author: CrashCourse;https://www.youtube.com/watch?v=bPFNxD3Yg6U;License: Standard YouTube License, CC-BY
Shape, Center, and Spread - Module 20.2 (Part 1); Author: Mrmathblog;https://www.youtube.com/watch?v=COaid7O_Gag;License: Standard YouTube License, CC-BY
Shape, Center and Spread; Author: Emily Murdock;https://www.youtube.com/watch?v=_YyW0DSCzpM;License: Standard Youtube License