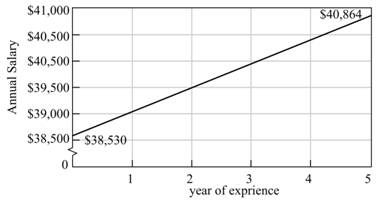
A linear function S ( t ) that fits the data using two given points in below graph. The graph shows teacher salaries for Nixon country for teachers whose highest degree is a bachelor's degree. Let S represent the annual teacher salary and let t represent years of experience.
A linear function S ( t ) that fits the data using two given points in below graph. The graph shows teacher salaries for Nixon country for teachers whose highest degree is a bachelor's degree. Let S represent the annual teacher salary and let t represent years of experience.
Solution Summary: The author calculates a linear function S(t) that fits the data using two given points in the graph.
To calculate: A linear function S(t) that fits the data using two given points in below graph.
The graph shows teacher salaries for Nixon country for teachers whose highest degree is a bachelor's degree. Let S represent the annual teacher salary and let t represent years of experience.
(b)
To determine
To calculate: The annual salary for a teacher with 3 years of experience, using the function S(t)=466.8t+38530. Also, compare answer with the graph to see whether the graph supports the answer or not.
(c)
To determine
To calculate: The annual salary for a teacher with 10 years of experience, assuming trend of the function S(t)=466.8t+38530 continues.
(d)
To determine
To calculate: The number of years of experience must a teacher have to earn annual salary of $41,330.8, assuming trend of the function S(t)=466.8t+38530 continues.
The Course Name Real Analysis please Solve questions by Real Analysis
part 3 of the question is:
A power outage occurs 6 min after the ride started. Passengers must wait for their cage to be manually cranked into the lowest position in order to exit the ride. Sine function model: where h is the height of the last passenger above the ground measured in feet and t is the time of operation of the ride in minutes.
What is the height of the last passenger at the moment of the power outage? Verify your answer by evaluating the sine function model.
Will the last passenger to board the ride need to wait in order to exit the ride? Explain.
2. The duration of the ride is 15 min.
(a) How many times does the last passenger who boarded the ride make a complete loop on the Ferris
wheel?
(b) What is the position of that passenger when the ride ends?
Chapter 3 Solutions
Intermediate Algebra For College Students (9th Edition)
Need a deep-dive on the concept behind this application? Look no further. Learn more about this topic, algebra and related others by exploring similar questions and additional content below.
01 - What Is A Differential Equation in Calculus? Learn to Solve Ordinary Differential Equations.; Author: Math and Science;https://www.youtube.com/watch?v=K80YEHQpx9g;License: Standard YouTube License, CC-BY
Higher Order Differential Equation with constant coefficient (GATE) (Part 1) l GATE 2018; Author: GATE Lectures by Dishank;https://www.youtube.com/watch?v=ODxP7BbqAjA;License: Standard YouTube License, CC-BY


 Glencoe Algebra 1, Student Edition, 9780079039897...AlgebraISBN:9780079039897Author:CarterPublisher:McGraw Hill
 Algebra & Trigonometry with Analytic GeometryAlgebraISBN:9781133382119Author:SwokowskiPublisher:Cengage
 Functions and Change: A Modeling Approach to Coll...AlgebraISBN:9781337111348Author:Bruce Crauder, Benny Evans, Alan NoellPublisher:Cengage Learning
 Holt Mcdougal Larson Pre-algebra: Student Edition...AlgebraISBN:9780547587776Author:HOLT MCDOUGALPublisher:HOLT MCDOUGAL
 College Algebra (MindTap Course List)AlgebraISBN:9781305652231Author:R. David Gustafson, Jeff HughesPublisher:Cengage Learning
 Big Ideas Math A Bridge To Success Algebra 1: Stu...AlgebraISBN:9781680331141Author:HOUGHTON MIFFLIN HARCOURTPublisher:Houghton Mifflin Harcourt