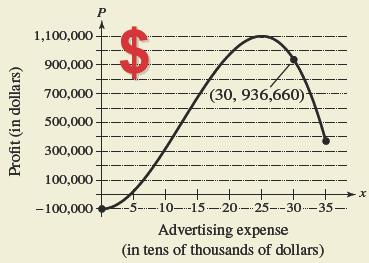
HOW DO YOU SEE IT? The graph below shows a company’s estimated profits for different advertising expenses. The company’s actual profit was $ 936 , 660 for an advertising expense of $ 300 , 000. (a) From the graph, it appears that the company could have obtained the same profit for a lesser advertising expense. Use the graph to estimate this expense. (b) The company’s model is P = – 140.75 x 3 + 5348.3 x 2 – 76 , 560 , 0 ≤ x ≤ 35 where P is the profit (in dollars) and x is the advertising expense (in tens of thousands of dollars).Explain how you could verify the lesser expense from part (a) algebraically.
HOW DO YOU SEE IT? The graph below shows a company’s estimated profits for different advertising expenses. The company’s actual profit was $ 936 , 660 for an advertising expense of $ 300 , 000. (a) From the graph, it appears that the company could have obtained the same profit for a lesser advertising expense. Use the graph to estimate this expense. (b) The company’s model is P = – 140.75 x 3 + 5348.3 x 2 – 76 , 560 , 0 ≤ x ≤ 35 where P is the profit (in dollars) and x is the advertising expense (in tens of thousands of dollars).Explain how you could verify the lesser expense from part (a) algebraically.
Solution Summary: The author analyzes how the company's profit at an advertising expense is 936,660 — the same profit also occurs at a lesser expense.
HOW DO YOU SEE IT? The graph below shows a company’s estimated profits for different advertising expenses. The company’s actual profit was
$
936
,
660
for an advertising expense of
$
300
,
000.
(a) From the graph, it appears that the company could have obtained the same profit for a lesser advertising expense. Use the graph to estimate this expense.
(b) The company’s model is
P
=
–
140.75
x
3
+
5348.3
x
2
–
76
,
560
,
0
≤
x
≤
35
where
P
is the profit (in dollars) and
x
is the advertising expense (in tens of thousands of dollars).Explain how you could verify the lesser expense from part (a) algebraically.
Evaluate the following expression and show your work to support your calculations.
a). 6!
b).
4!
3!0!
7!
c).
5!2!
d). 5!2!
e).
n!
(n - 1)!
Amy and Samiha have a hat that contains two playing cards, one ace and one king. They are playing a game where they randomly pick a card out of the hat four times, with replacement.
Amy thinks that the probability of getting exactly two aces in four picks is equal to the probability of not getting exactly two aces in four picks. Samiha disagrees. She thinks that the probability of not getting exactly two aces is greater.
The sample space of possible outcomes is listed below. A represents an ace, and K represents a king. Who is correct?
Consider the exponential function f(x) = 12x. Complete the sentences about the key features of the graph.
The domain is all real numbers.
The range is y> 0.
The equation of the asymptote is y = 0
The y-intercept is 1
Need a deep-dive on the concept behind this application? Look no further. Learn more about this topic, algebra and related others by exploring similar questions and additional content below.


 Holt Mcdougal Larson Pre-algebra: Student Edition...AlgebraISBN:9780547587776Author:HOLT MCDOUGALPublisher:HOLT MCDOUGAL
 Algebra: Structure And Method, Book 1AlgebraISBN:9780395977224Author:Richard G. Brown, Mary P. Dolciani, Robert H. Sorgenfrey, William L. ColePublisher:McDougal Littell
 Elementary AlgebraAlgebraISBN:9780998625713Author:Lynn Marecek, MaryAnne Anthony-SmithPublisher:OpenStax - Rice University
 Algebra and Trigonometry (MindTap Course List)AlgebraISBN:9781305071742Author:James Stewart, Lothar Redlin, Saleem WatsonPublisher:Cengage Learning